Data transformation is a fundamental step in the data analytics process, involving the modification and preparation of raw data into a format suitable for analysis. In Power BI, Microsoft’s premier analytics service, data transformation is handled through Power Query, a powerful tool integrated into the platform. This article explores different data transformation techniques in Power BI, providing insights on how to effectively utilize these methods to improve your data analysis efforts.
Data transformation in Power BI is primarily conducted in Power Query Editor, a feature-rich environment designed for detailed data preparation tasks. Here, data from diverse sources can be cleaned, transformed, and loaded (ETL) into Power BI, making it ready for creating insightful, actionable reports.
- Data Cleaning: Removing duplicates, fixing errors, and dealing with missing values to improve data quality.
- Type Conversion: Changing data types (e.g., text to number, date formats) to ensure correct data interpretation and calculation.
- Pivoting and Unpivoting: Restructuring data tables from wide (pivoted) to long (unpivoted) formats or vice versa, which is essential for analysis.
- Merging and Appending: Combining data from multiple sources to create a comprehensive dataset.
- Conditional Columns: Adding new columns based on conditions derived from other data points.
- Grouping and Aggregating: Summarizing data by categories to see trends or distributions.
Power BI’s Power Query Editor provides a user-friendly interface to apply these transformations with minimal coding requirements. Below is a step-by-step guide to performing some common data transformations:
Step 1: Accessing Power Query Editor
- Open Power BI Desktop.
- Navigate to ‘Home’ > ‘Transform Data’ to open Power Query Editor.
Step 2: Executing Transformations
Cleaning Data: Cleaning data often involves multiple steps, such as removing duplicates, filtering rows, or handling missing values.
- Remove Duplicates: Select the column(s) from which you want to remove duplicates, then go to the "Home" tab and click "Remove Duplicates":
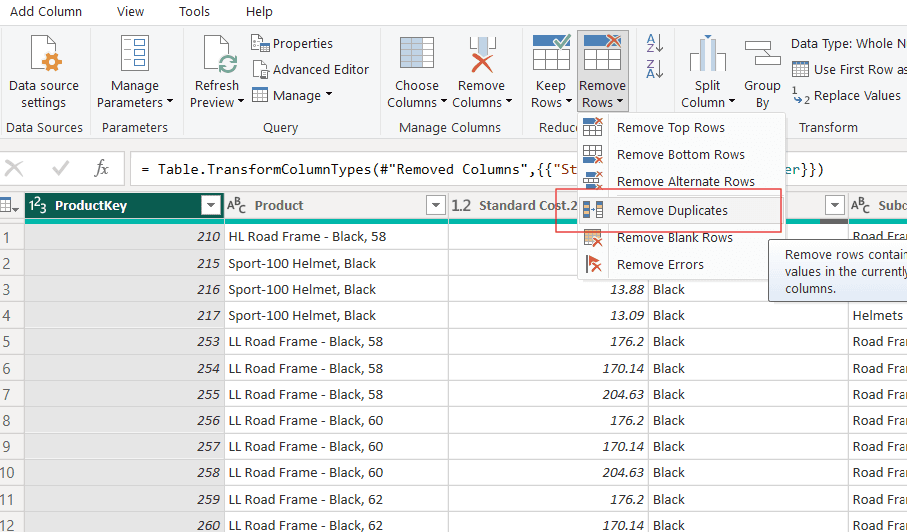
Remove Duplicates in Power BI
- Remove Columns: Right-click the column you want to remove and select "Remove":
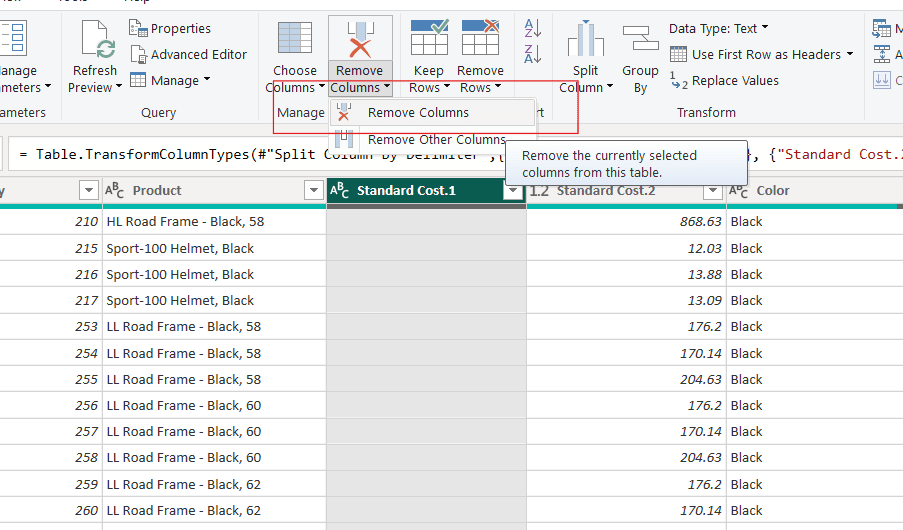
Remove Columns in Power BI
- Replacing Values: Replace specific values within your data, such as substituting "N/A" with null values or standardizing names.
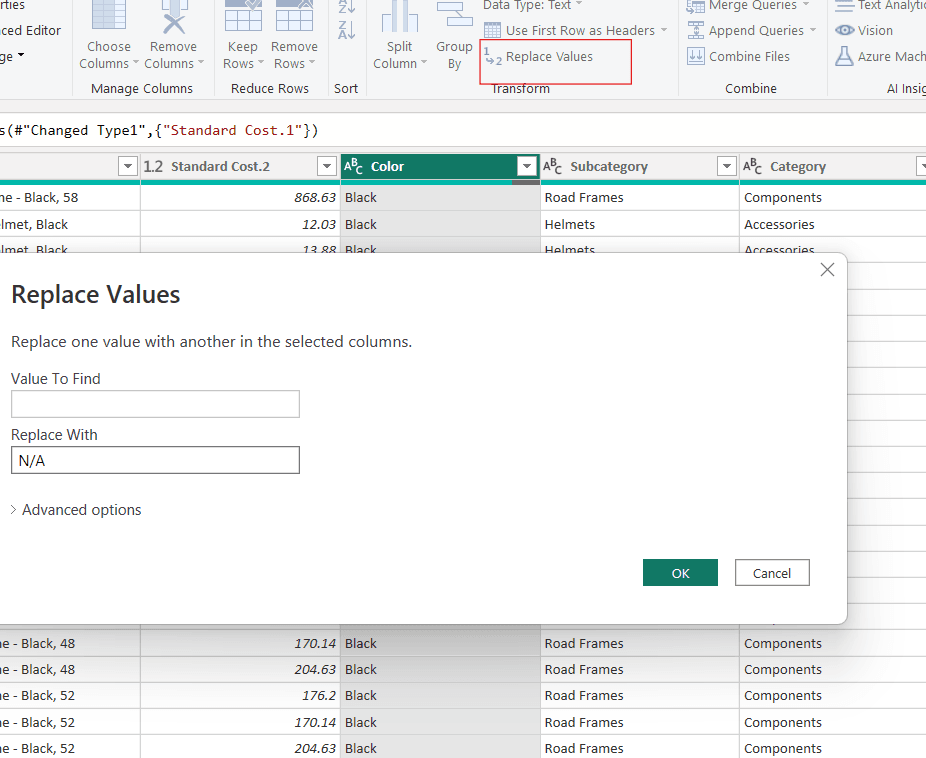
Replacing Missing Values with N/A
- Type Conversion: Click on the column you want to convert. In the "Transform" tab, choose "Data Type" and select the appropriate type (e.g., Text, Whole Number, Decimal Number, Date, etc.):
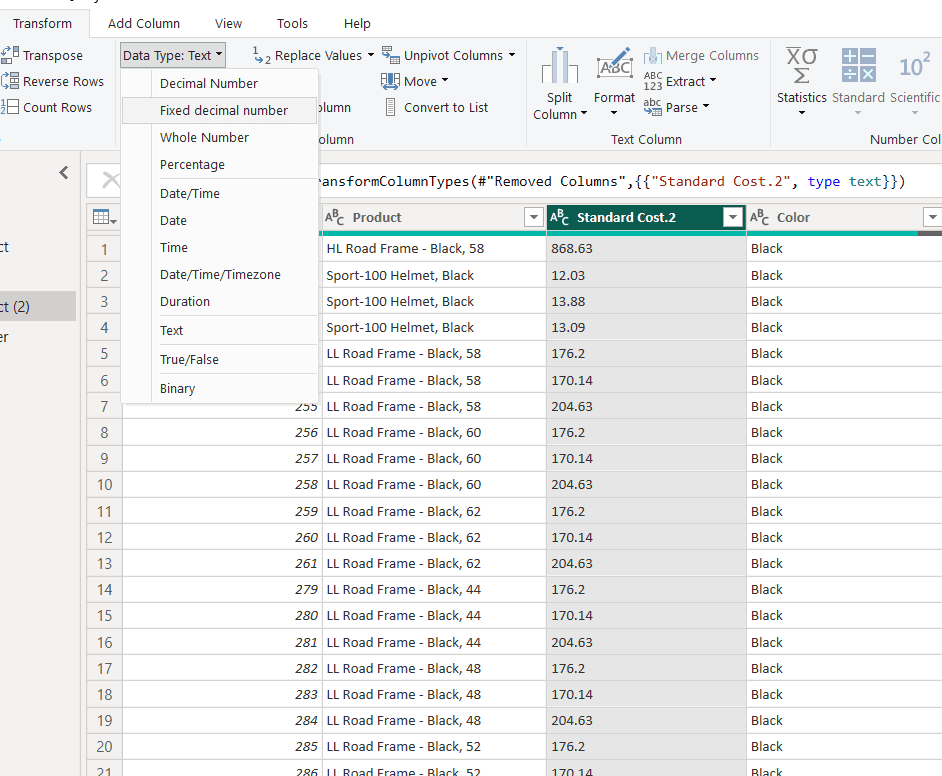
Converting Text Data Type to Number
- Pivoting/Unpivoting Data: Under the ‘Transform’ tab, use ‘Pivot Column’ for pivoting or ‘Unpivot Columns’ for unpivoting. To pivot, select the column that contains the values which will become new column headers. Go to "Transform" > "Pivot Column". Choose the column to pivot on and the values column:
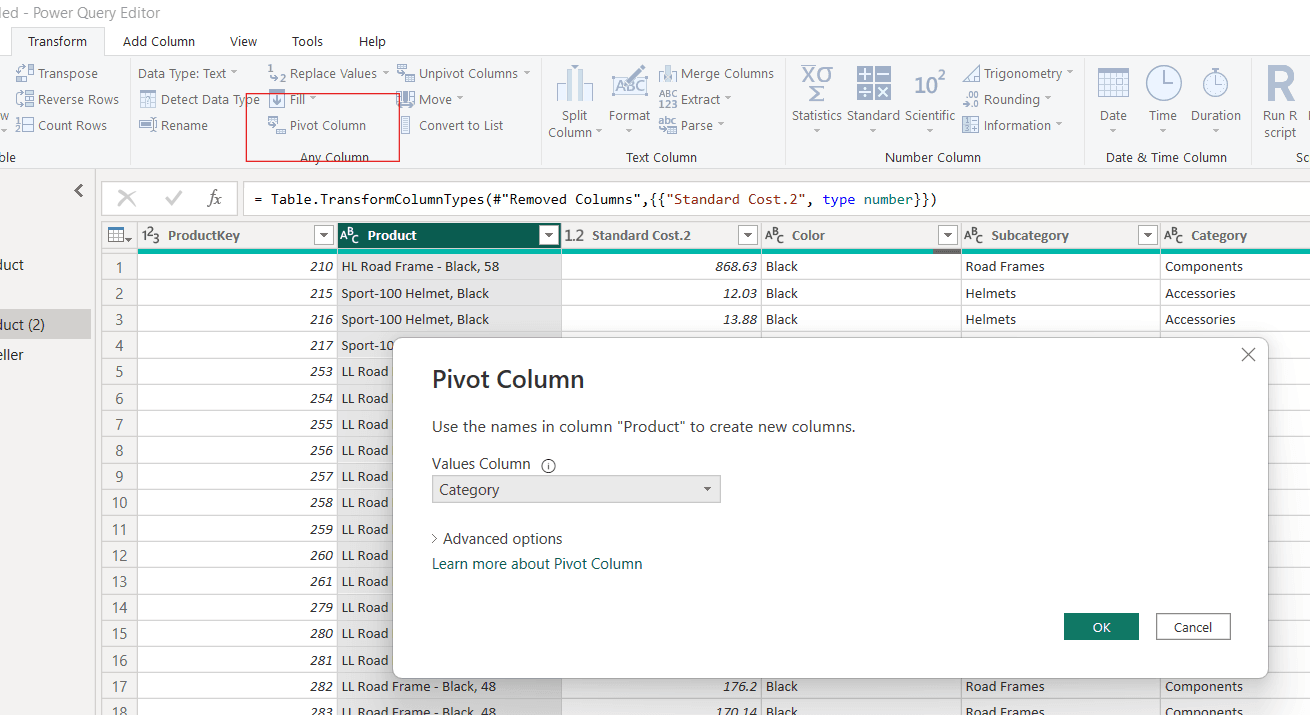
Pivoting a Column
Merging Data:
- Open Power Query Editor: Go to "Home" > "Edit Queries".
- New Query: Click "Merge Queries" in the "Home" tab.
- Select the Main Table: Choose the first table from the dropdown.
- Select the Table to Merge: Choose the second table from the dropdown.
- Choose Columns to Match: Select the matching columns in both tables.
- Specify Join Kind: Choose the type of join (e.g., Inner, Full Outer, Left Outer, Right Outer).
- OK: Click OK to merge the tables.
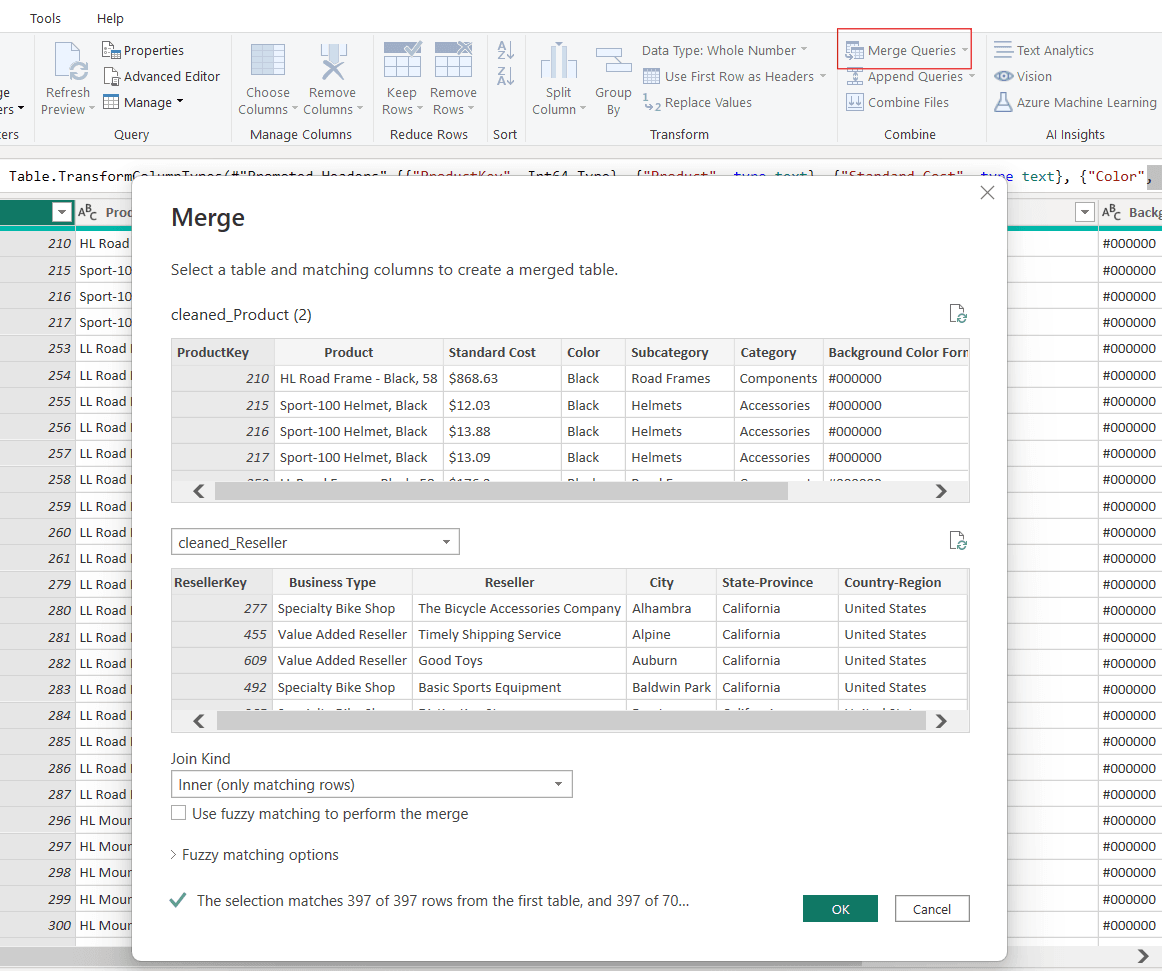
Merging tables with a common column
- Adding Conditional Columns: From the ‘Add Column’ tab, choose ‘Conditional Column’ and define the conditions and outputs for each scenario:
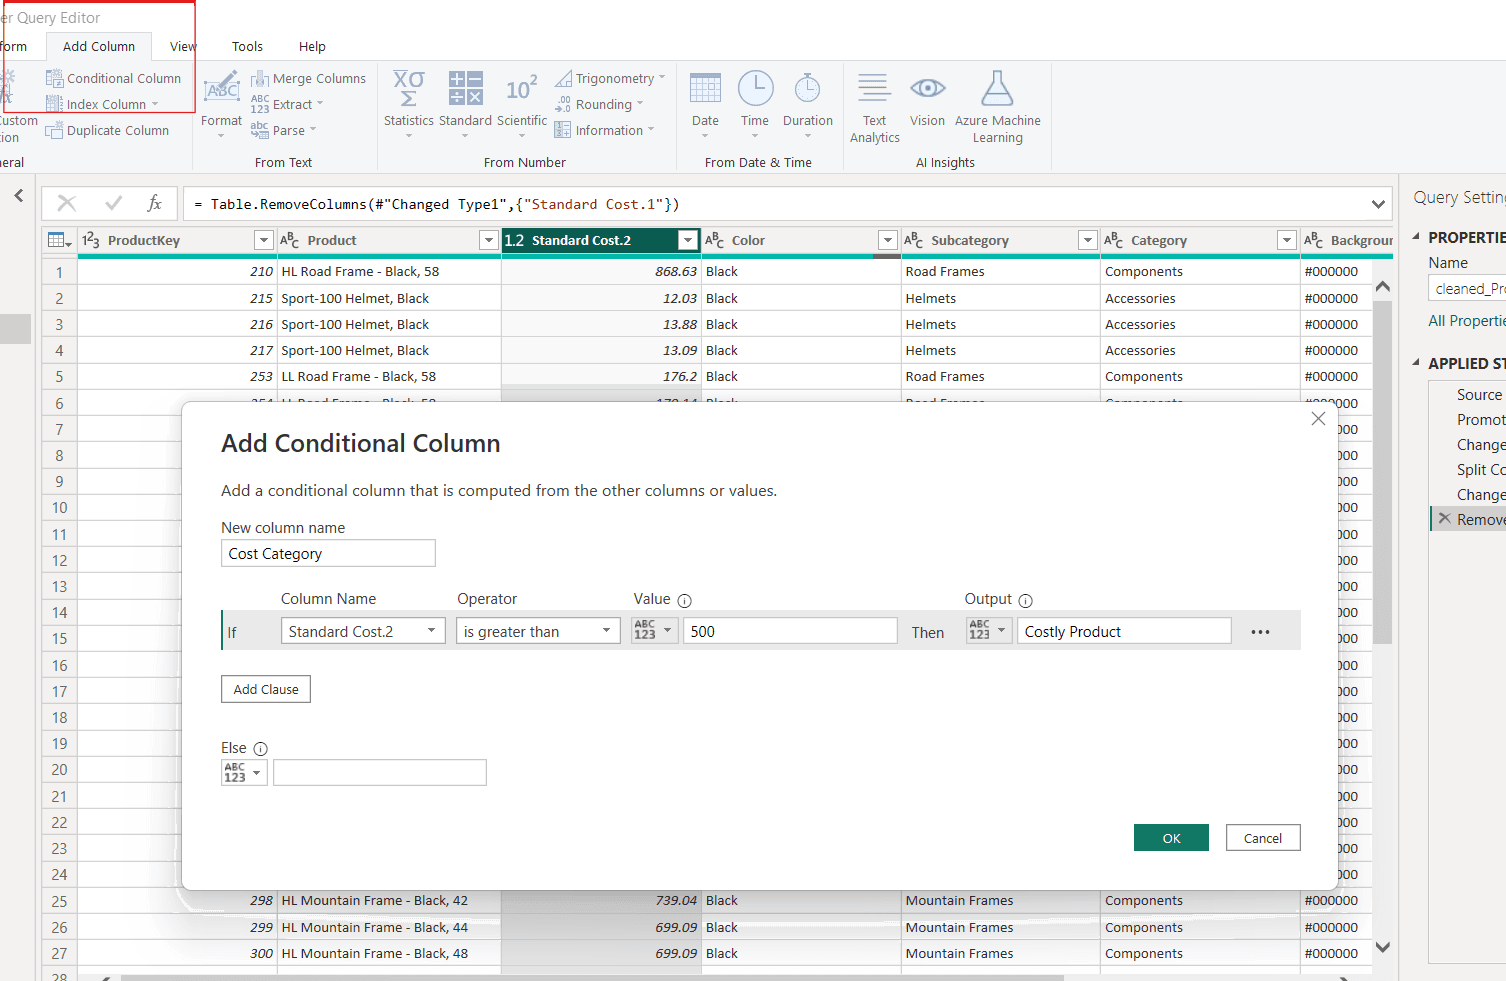
Adding Conditional Columns
- Grouping Data: In the "Home" tab, click "Group By". Choose the column to group by, and specify the aggregation function (e.g., Count, Sum, Average, Max, Min) and the column to perform the function on.
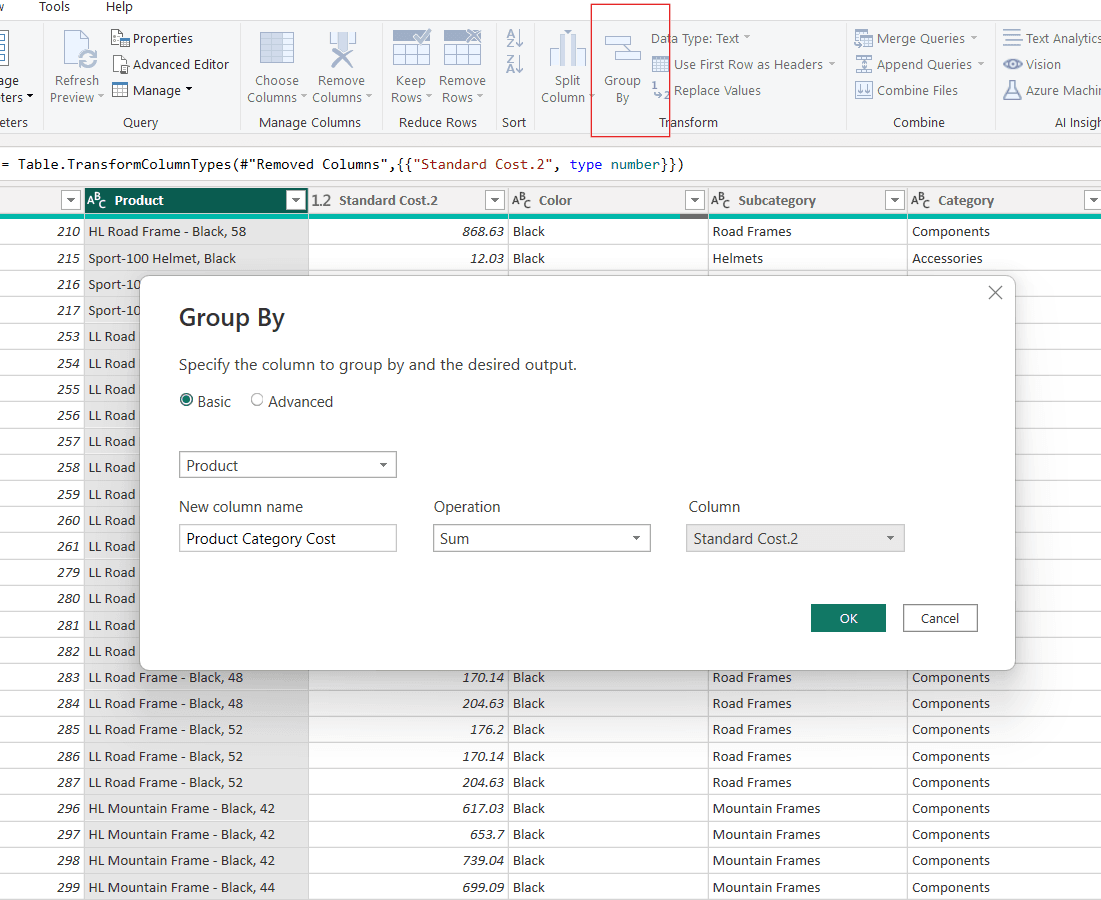
Grouping Data
Step 3: Applying and Loading Transformations
- After performing the desired transformations, click ‘Close & Apply’ to load the transformed data into Power BI for reporting and visualization.
- Overlooking Data Privacy and Security: When transforming data, it's crucial to ensure data is secure and compliant with privacy laws to prevent unauthorized access and breaches.
- Neglecting Data Validation: Many overlook the importance of validating transformed data, which can lead to analytics based on inaccurate or inconsistent data.
- Excessive Use of Manual Steps: Relying heavily on manual data transformation processes can introduce errors and inefficiencies; automation is key to consistency and reliability.
- Plan Ahead: Before transforming data, understand the requirements of your analysis to ensure that transformations align with business needs.
- Maintain Data Quality: Regularly review and update transformation steps as source data changes to maintain the integrity and accuracy of your reports.
- Optimize Performance: Limit the number of steps by combining transformations where possible, which can improve the performance of your Power BI reports.
The data transformation techniques outlined in this guide are not only pivotal for Power BI users but also play a crucial role in other areas such as data mining and exploratory data analysis (EDA).Few examples of data transformation techniques in data mining are normalization (scaling data to a specific range), attribute selection (selecting relevant features for analysis), and binning (grouping continuous data into categories) which are crucial for preparing data for complex algorithms and ensuring better accuracy and efficiency. Similarly, best examples of data transformation techniques in eda are log transformations (to stabilize variance across data) and handling outliers (to mitigate skewness in data distribution) which ensures that the datasets are well-prepared for various analytical methods and visualizations. These transformations are integral to maximizing the integrity and usefulness of the data, empowering data professionals to derive more accurate and insightful conclusions from their analyses.
Conclusion
Effective data transformation is key to unlocking the full potential of Power BI for organizational analytics. By mastering the techniques outlined in this guide, users can ensure their data is not only accurate and comprehensive but also optimally formatted for extracting the most valuable insights.
- Data transformation in Power BI utilizes Power Query to modify raw data for analysis, emphasizing the transformation of data from various sources into actionable insights.
- Key data transformation techniques include data cleaning (removing duplicates and errors), type conversion (ensuring accurate data interpretation), and restructuring data tables through pivoting and unpivoting.
- Additional techniques involve merging multiple data sources to create comprehensive datasets and adding conditional columns based on existing data to enrich analysis.
- The process of data transformation in Power BI involves minimal coding, with a step-by-step approach in the Power Query Editor for executing tasks such as cleaning data and merging tables.
- Common pitfalls in data transformation include neglecting data privacy and security, failing to validate data accuracy, and over-reliance on manual transformation processes which can introduce errors.
- Best practices recommend planning ahead to align transformations with business needs, regularly updating transformation steps to maintain data integrity, and optimizing performance by minimizing transformation steps.
- Data transformation techniques also apply to fields like data mining and exploratory data analysis (EDA), where they help in normalizing data, selecting relevant features, and handling outliers to prepare data for advanced analysis.


