Power BI, a powerful business analytics tool by Microsoft, enables users to visualize data and share insights across their organizations. Among its many features, filters and slicers stand out for their ability to refine data presentations and enhance user interactions. This article explores filter vs slicer in Power BI and functions, applications, and benefits of filters and slicers, providing a comprehensive guide for users aiming to leverage these tools effectively.
Filters in Power BI
Filters in Power BI are used to narrow down the data that is displayed in reports and dashboards. They help in focusing on specific data points by eliminating the irrelevant ones. Filters can be applied at various levels, including the report, page, and visual levels.
Types of Filters in Power BI
- Report-Level Filters: These filters apply to the entire report, affecting all pages and visuals within it. They are useful for maintaining a consistent filtering context across multiple report pages.
- Page-Level Filters: As the name suggests, page-level filters are applied to a single page within a report. They help in tailoring the data view for specific sections without affecting other pages.
- Visual-Level Filters: These filters are applied to individual visuals, allowing users to refine the data displayed in a specific chart, table, or any other visual element. Visual-level filters provide granular control over the data presented.
- Drillthrough Filters: Drillthrough filters enable users to create a detailed view of data by drilling through from one report page to another. They are particularly useful for analyzing data hierarchies and gaining deeper insights.
- Cross-Report Filters: These filters can be used to maintain filter context across multiple reports, ensuring a cohesive analysis experience when dealing with related datasets.
How to Apply Filters
To apply filters, follow these steps:
- Adding a Filter:
- Open your Power BI report.
- Go to the "Fields" pane and select the field you want to use as a filter.
- Drag the selected field into the "Filters" pane.
- Configuring the Filter:
- Choose the filter type (e.g., Basic filtering, Advanced filtering, Relative date filtering) from the dropdown menu in the Filters pane.
- Set the filter criteria based on your requirements.
- Applying the Filter:
- Filters can be applied at the visual, page, or report level.
- Adjust the filter scope by dragging the field to the appropriate level in the Filters pane.
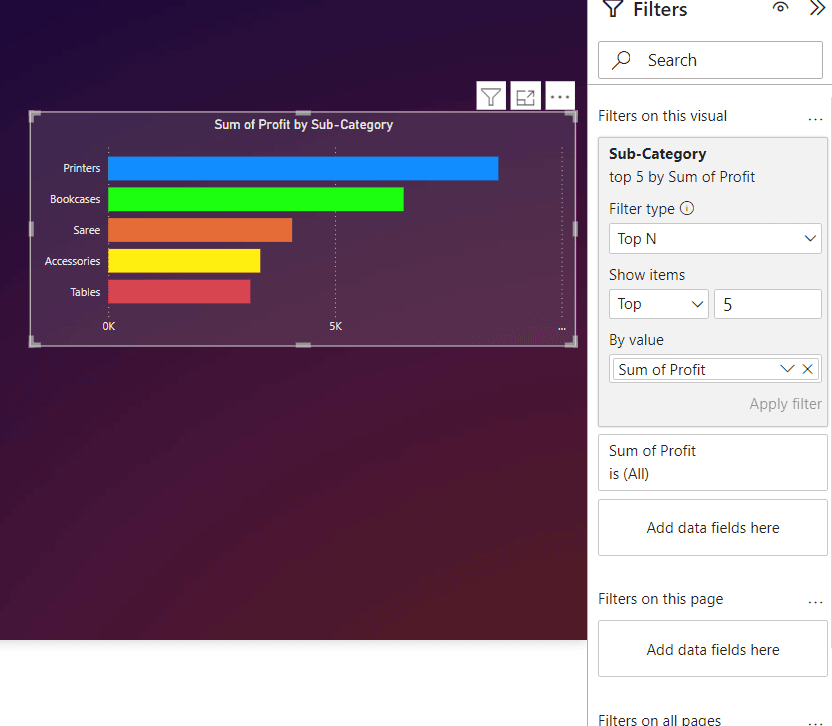
Applying Filters and its types
Benefits of Filters
- Focused Data Analysis: Filters allow users to focus on specific data segments, making analysis more relevant and manageable.
- Improved Performance: By displaying only relevant data, filters can enhance report performance, reducing the load time.
- Enhanced Clarity: Filters help in decluttering visuals, presenting a clearer picture of the data.
Slicers in Power BI
Slicers are a visual filtering tool in Power BI that provide an interactive way to filter data. They are displayed as buttons, dropdowns, or list boxes on the report canvas, allowing users to dynamically filter the data by selecting one or multiple values.
Types of Slicers in Power BI
- List Slicer: Displays data values as a list, enabling users to select one or more items to filter the data.
- Dropdown Slicer: Provides a dropdown menu to select data values, conserving space on the report canvas.
- Date Slicer: Specifically designed for filtering date fields, this slicer allows users to select date ranges, individual dates, or relative dates.
- Hierarchical Slicer: Displays data in a hierarchical format, allowing users to drill down through multiple levels of data.
- Numeric Range Slicer: Enables users to filter data based on a range of numeric values, providing a slider or input boxes to define the range.
How to Use Slicers
To use slicers, follow these steps:
- Adding a Slicer:
- Open your Power BI report.
- Go to the "Visualizations" pane and select the "Slicer" icon.
- Drag and drop the slicer onto the report canvas.
- Configuring the Slicer:
- Select the field you want to use for the slicer from the "Fields" pane.
- Adjust the slicer settings, such as format and orientation, in the "Format" pane.
- Interacting with the Slicer:
- Users can click on the slicer values to filter the data in real-time.
- To select multiple values, use the Ctrl key (for single-click) or the checkbox option.
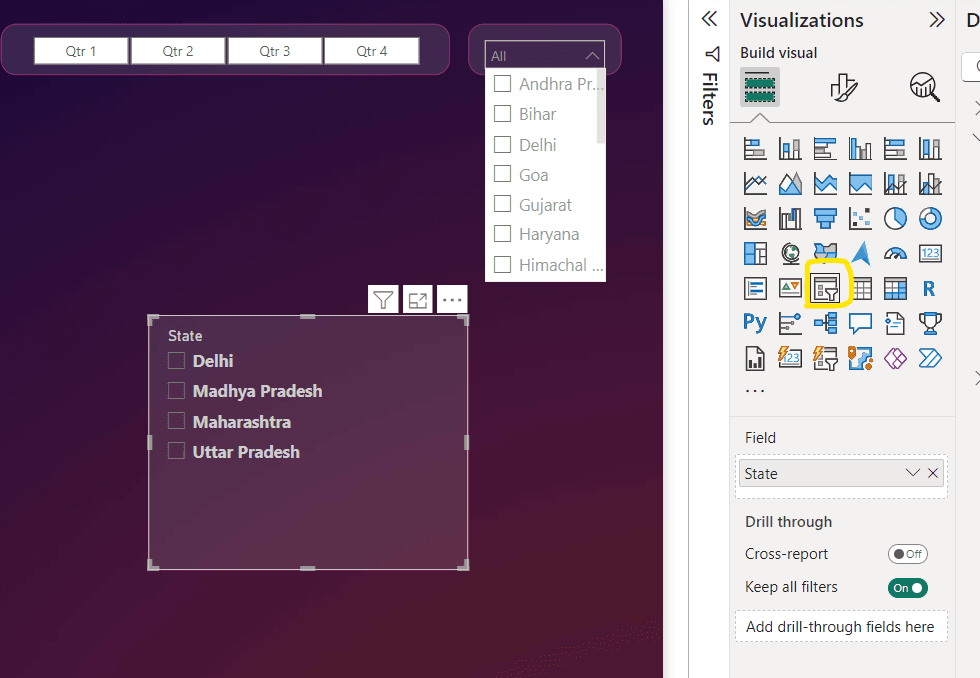
Applying Slicers and its types
Benefits of Slicers
- Interactive Data Exploration: Slicers provide an interactive way for users to filter data, making it easy to explore different data perspectives.
- User-Friendly Interface: The visual and intuitive nature of slicers enhances user experience and accessibility.
- Dynamic Reports: Slicers enable the creation of dynamic and responsive reports, allowing users to adjust filters on the fly.
Difference Between Slicer and Filter in Power BI
Visual Representation:
- Slicers: Always visible on the report canvas, providing an interactive element for users.
- Filters: Typically operate in the background, accessible through the filter pane.
User Interaction:
- Slicers: Designed for end-user interaction, allowing users to directly select and manipulate data.
- Filters: Primarily used by report designers for background data control, with limited end-user interaction.
Application Scope:
- Slicers: Affect all visuals connected to the data on the report canvas.
- Filters: Can be applied at various levels (visual, page, report), providing flexible data control.
Customization and Complexity:
- Slicers: Simple to set up and use, with limited customization options compared to filters.
- Filters: Offer more complex and detailed data control, with advanced filtering capabilities.
Slicer vs Filter in Power BI: Practical Applications
Sales Reports
In sales reports, filters and slicers can be used to analyze sales performance across different regions, time periods, and product categories. For instance, a sales manager can use a date slicer to compare sales performance between different quarters.
Financial Dashboards
Financial dashboards benefit from filters and slicers by enabling detailed financial analysis. Filters can be used to display specific account balances, while slicers allow users to focus on particular fiscal years or departments.
Customer Insights
Filters and slicers help in analyzing customer data, such as purchase history and demographics. Marketing teams can use slicers to segment customers by age group, purchase frequency, or geographical location, providing deeper insights into customer behavior.
Best Practices for Using Filters and Slicers
To effectively utilize filters and slicers in Power BI, consider the following best practices:
- Plan Your Filtering Strategy: Determine the filtering needs based on the audience and purpose of the report. Use a combination of report-level, page-level, and visual-level filters to achieve the desired granularity.
- Keep It Simple: Avoid overcomplicating filters and slicers. Too many options can overwhelm users and make the report difficult to navigate.
- Use Clear Labels: Ensure that slicers and filters are clearly labeled to indicate their purpose. This helps users understand the context and impact of their selections.
- Optimize Performance: Filters and slicers can impact report performance, especially with large datasets. Use them judiciously and consider performance optimization techniques, such as aggregations and data reduction.
- Test and Validate: Always test filters and slicers to ensure they work as intended. Validate that the filtered data aligns with the expected outcomes and that there are no unintended consequences.
Conclusion
Filters and slicers are powerful tools in Power BI that enhance data interactivity and analysis. By enabling users to focus on specific data points and dynamically explore insights, they play a crucial role in creating meaningful and impactful reports. By understanding difference between filter and slicer in Power BI and their types, implementation, and best practices, you can leverage filters and slicers to unlock the full potential of your Power BI reports, delivering more relevant and actionable insights to your audience.
Key Takeaways on Slicer vs Filter in Power BI
- Slicers are visible on the report canvas, allowing users to interactively select data segments, while filters typically operate in the background.
- Slicers are designed for easy end-user interaction with lists, drop-downs, or checkboxes, providing immediate feedback on data changes.
- Filters can be applied at multiple levels (visual, page, report), offering flexible and detailed data control.
- Slicers can be customized in terms of appearance, format, and arrangement, making them ideal for interactive dashboards.
- Filters provide more detailed data refinement options, including advanced settings like relative dates and top N filters.
- Slicers are ideal for dashboards where quick, visual data manipulation by users is required, enhancing user interaction and exploration.
- Filters are suitable for scenarios requiring detailed and complex data control without cluttering the report canvas, primarily managed by report designers.
- To use slicers, add a slicer visual to the report, configure it by selecting the relevant field, and allow users to interact with the slicer to filter data in real-time.
- To use filters, add the desired field to the Filters pane, configure the filter criteria, and apply it at the appropriate scope (visual, page, report) for refined data control.
- Practical scenarios include using slicers for interactive sales dashboards, applying filters for detailed financial reports, and combining both for comprehensive employee performance analyses.


