Power BI is a powerful business analytics tool that enables organizations to visualize data and share insights across their enterprise. However, as data models grow in complexity, performance can suffer, leading to slow report loading times and user frustration. Performance optimization in Power BI involves various techniques to enhance report efficiency, reduce load times, and provide a smoother user experience. This article explores key strategies and tools, including the Power BI Performance Analyzer, to help optimize performance and improve overall report efficiency.
Performance optimization in Power BI involves techniques to improve report performance, including model optimization, DAX query tuning, visual optimization, and data refresh efficiency. The main objective is to ensure that Power BI reports and dashboards are responsive and provide users with timely insights.
Data Model Optimization
Optimizing the data model is one of the most critical steps in enhancing Power BI performance. A well-structured data model in Power BI reduces memory usage and speeds up data processing.
- Simplify Data Models: Avoid unnecessary columns, rows, and calculations. Use only the required data to minimize the model size.
- Use Star Schema: Prefer the star schema over the snowflake schema. A star schema simplifies relationships and improves query performance.

Star Schema Diagram
- Reduce Cardinality: Lower cardinality (the uniqueness of values in a column) improves performance. For example, avoid using high cardinality columns like transaction IDs in relationships.
- Aggregate Data: Pre-aggregate data at the source to reduce the amount of data loaded into Power BI. Aggregations reduce the need for complex calculations at runtime.
Optimizing DAX Queries
DAX (Data Analysis Expressions) is used in Power BI to create custom calculations. Poorly written DAX queries can slow down reports significantly.
- Avoid Calculated Columns: Use measures instead of calculated columns whenever possible. Measures are evaluated at runtime and do not consume additional storage.
- Use Variables in DAX: Variables can store intermediate results, reducing the number of calculations needed and improving readability and performance.
- Filter Context Optimization: Optimize filter context to minimize the number of rows processed. Use specific functions like KEEPFILTERS to manage context efficiently.
- Replace Iterators with Aggregators: Iterators like SUMX can be resource-intensive. Replace them with aggregators like SUM, MIN, or MAX whenever possible.
Reducing Visual Complexity
The complexity and number of visuals on a Power BI report page can impact performance. Each visual generates a query that runs against the data model.
- Minimize Number of Visuals: Limit the number of visuals on a report page. Each visual adds to the processing load and increases the time required to render the report.
- Use Conditional Formatting Sparingly: While visually appealing, excessive conditional formatting can slow down report performance.
- Optimize Slicers: Use slicers wisely. Avoid high-cardinality slicers and opt for dropdowns instead of lists to reduce visual clutter and improve performance.
- Avoid Using Custom Visuals: Custom visuals can be less optimized than standard visuals. Use them only when absolutely necessary.
Data Refresh Optimization
Optimizing the data refresh process ensures that Power BI datasets are updated efficiently without impacting performance.
- Incremental Refresh: Use incremental refresh to update only the changed data rather than reloading the entire dataset, which can save time and reduce resource consumption.
- DirectQuery vs. Import Mode: Use Import mode for large datasets to improve performance. DirectQuery can be used for real-time data needs but might impact report speed.
- Schedule Data Refreshes Wisely: Schedule data refreshes during off-peak hours to avoid slowing down the system during peak usage times.
The Performance Analyzer in Power BI is a built-in tool that helps identify and troubleshoot performance issues in reports. It provides insights into the time taken by each visual, DAX query, and other operations during the report rendering process.
Key Features of Performance Analyzer
- Recording Performance: The Performance Analyzer records the time taken by each visual to load, allowing users to pinpoint which visuals are slowing down the report.
- Breakdown of Operations: It breaks down the report's load time into categories such as DAX Query, Visual Display, and Other, helping users understand where performance issues lie.
- Export Diagnostics: Users can export the analysis data to a .json file for detailed examination, which can help in optimizing specific components.
Steps to Use Performance Analyzer in Power BI
1. Open the Performance Analyzer: In Power BI Desktop, go to the "View" tab and select "Performance Analyzer."

Performance Analyzer Button
2. Start Recording: Click "Start Recording" to begin analyzing the performance of the report.
3. Refresh the Report: Refresh the report to capture the performance data for all visuals.
4. Review Results: The Performance Analyzer will display the load times for each visual. Examine the breakdown to identify slow components.
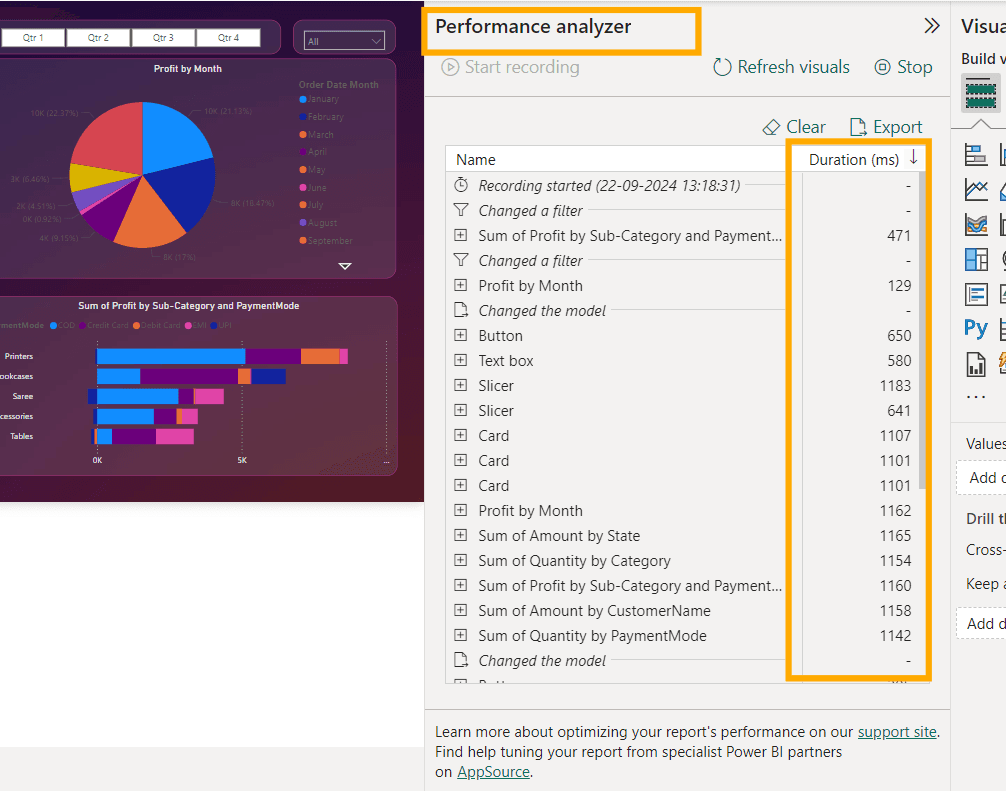
Using Performance Analyzer
5. Optimize: Use the insights to optimize the identified bottlenecks, such as rewriting DAX queries or simplifying visuals.
6. Export - Export the analysed data to the local system.
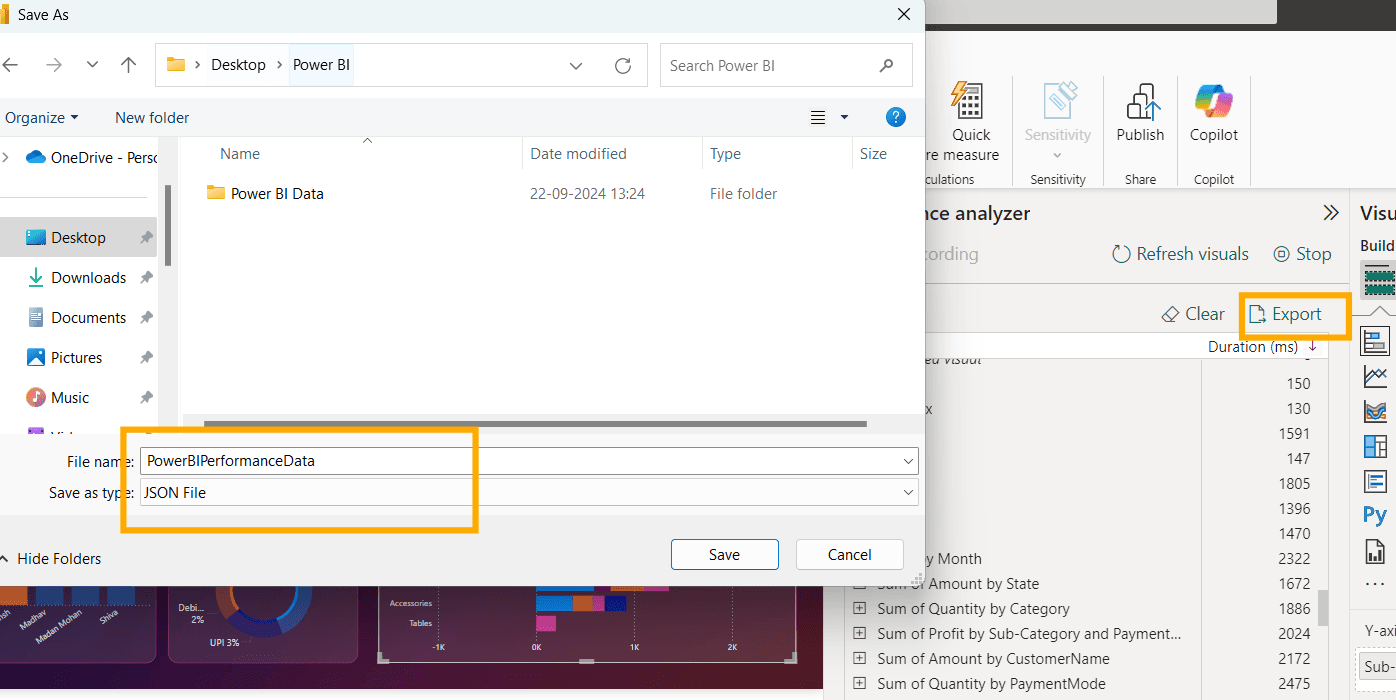
Export data
- Avoid Unnecessary Calculations: Minimize on-the-fly calculations by pre-calculating values in the data source.
- Optimize Data Sources: Ensure data sources are optimized. Use indexing and data cleansing techniques at the source level to improve performance.
- Limit Real-Time Data Fetching: Use DirectQuery sparingly. Opt for cached data wherever possible to reduce live query processing times.
- Manage Relationships: Use single-directional filters where possible, and avoid bi-directional filtering unless absolutely necessary.
- Reduce Query Folding: Query folding can offload operations to the data source. Use Power Query transformations that support query folding to enhance performance.
Conclusion
Performance optimization in Power BI is crucial for ensuring a smooth and efficient user experience. By optimizing data models, tuning DAX queries, managing visuals, and utilizing the Performance Analyzer tool, users can significantly enhance report performance. Implementing these strategies allows Power BI reports to deliver insights faster and more effectively, driving better decision-making within organizations.
Performance tuning is not a one-time task; it requires continuous monitoring and adjustment as data and report requirements evolve. By adopting these best practices, organizations can ensure their Power BI reports remain efficient and responsive, even as they scale in complexity and size.
- Performance optimization in Power BI enhances report efficiency, reduces load times, and improves user experience.
- Data model optimization involves simplifying models, using star schemas, reducing cardinality, and pre-aggregating data.
- DAX query optimization includes using measures over calculated columns, leveraging variables, optimizing filter contexts, and replacing iterators with aggregators.
- Reducing visual complexity involves minimizing visuals, limiting conditional formatting, optimizing slicers, and avoiding custom visuals when possible.
- Data refresh optimization strategies include using incremental refresh, selecting appropriate data modes, and scheduling refreshes during off-peak hours.
- The Performance Analyzer tool in Power BI helps identify performance bottlenecks by recording load times for each visual and operation.
- Performance Analyzer breaks down report load times into DAX Query, Visual Display, and Other operations.
- Users can export Performance Analyzer data for detailed examination to identify specific performance issues.
- Best practices include avoiding unnecessary calculations, optimizing data sources, and managing relationships effectively.
- Limit real-time data fetching and use cached data to reduce processing times.
- Query folding should be used to push operations back to the data source for better performance.
- Continuous performance monitoring and adjustments are essential to maintaining efficient and responsive Power BI reports.


