Power BI, Microsoft's interactive business intelligence and data visualization tool, offers a plethora of features for data manipulation and analysis. Among these, the pivot and unpivot transformations are powerful techniques for reshaping data, making it easier to analyze and report. In this article, we will explore how to effectively use pivot and unpivot transformations in Power BI to enhance your data modeling and reporting capabilities.
Pivot in Power BI
In Power BI, "pivot" typically refers to the action of reorganizing or rearranging data in a table to summarize or highlight certain aspects of the data. This is done to transform data to see it from different perspectives and extract useful information or insights. Pivoting in Power BI is a data transformation technique that changes the data format from a long format to a wide format. It essentially transforms or "pivots" your data by turning unique values from one column into multiple columns, thus allowing you to summarize and reorganize your data more effectively for analysis. Pivoting is particularly useful when your data has key-value pairs in rows that you want to transform into a more readable and analyzable format.To pivot data means to transform rows into columns, usually to summarize data. For example, consider an unpivoted dataset in the following format:
| Region | Product | Month | Sales |
|---|
| North | A | January | 100 |
| North | A | February | 150 |
| North | A | March | 200 |
| ... | ... | ... | ... |
Steps to Pivot Data:
- Load Data: First, load your data into Power BI.
- Open Power Query Editor: Click on "Transform Data" in the Home tab to open the Power Query Editor.
- Select the Table: Ensure your table is selected in the left pane.
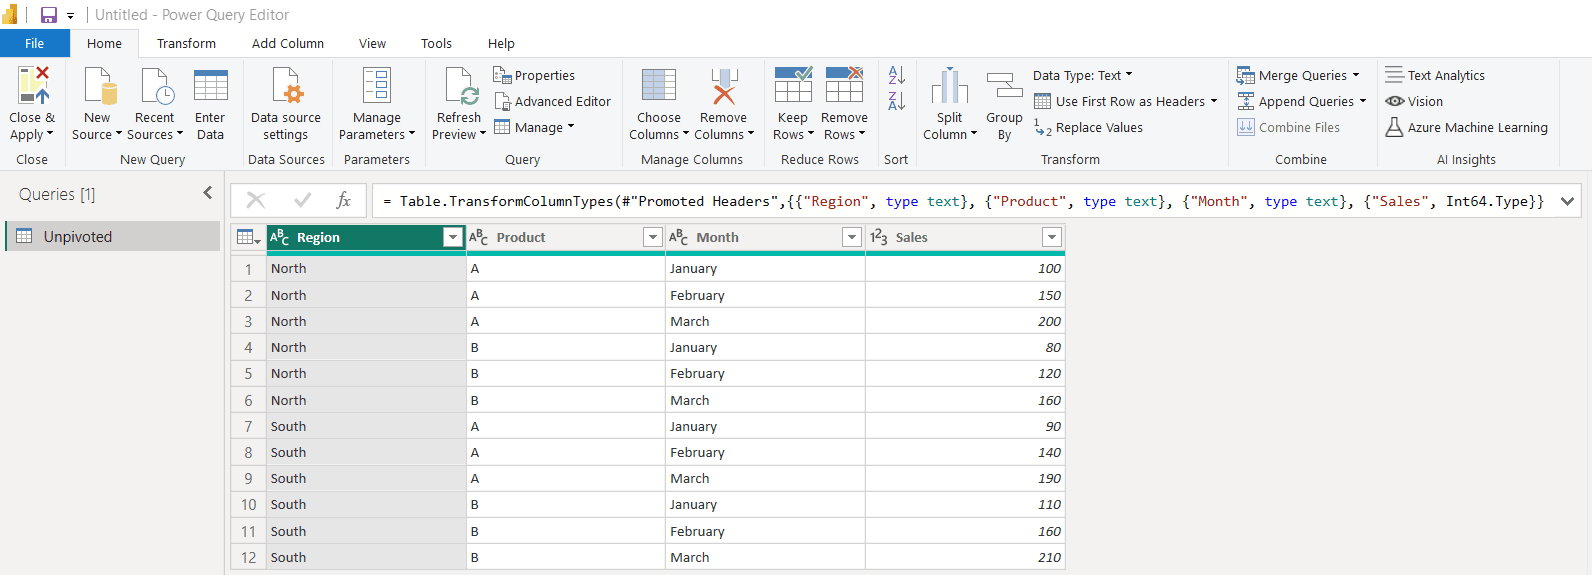
Loading Unpivoted Dataset
4. Choose Columns to Pivot: In the editor, select the column you want to use to create new columns. For your dataset, this would be the 'Month' column.
5. Pivot Column in Power BI:
- Go to the "Transform" tab.
- Click on "Pivot Column".
- For the "Values Column", choose 'Sales'.
- In the "Advanced options", choose "Don't Aggregate" if each cell contains unique data. Otherwise, select an appropriate aggregation method like "Sum", "Average", etc.
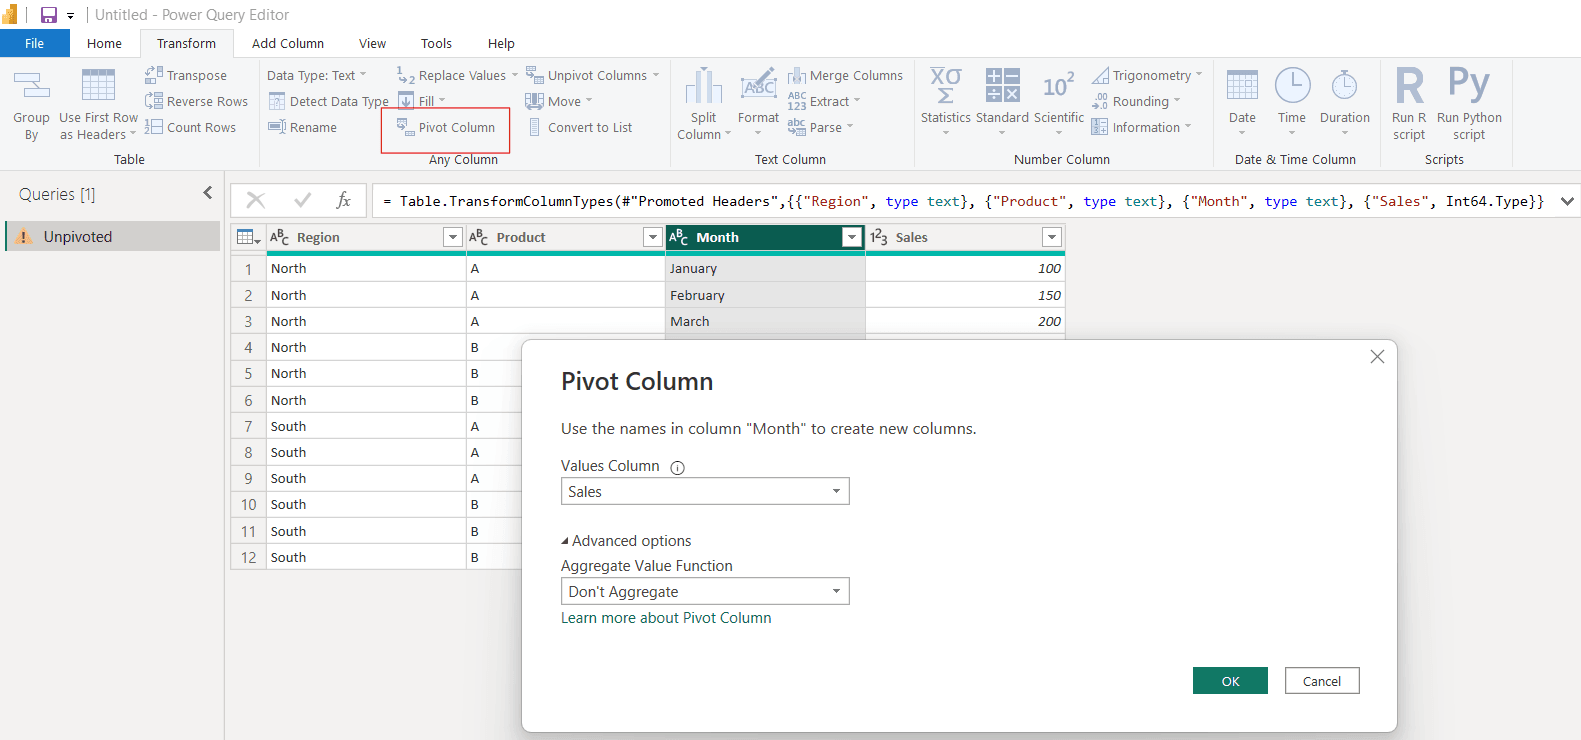
Pivoting the Data Using Months Column
6. Apply & Close: Apply the changes and close the Power Query Editor.
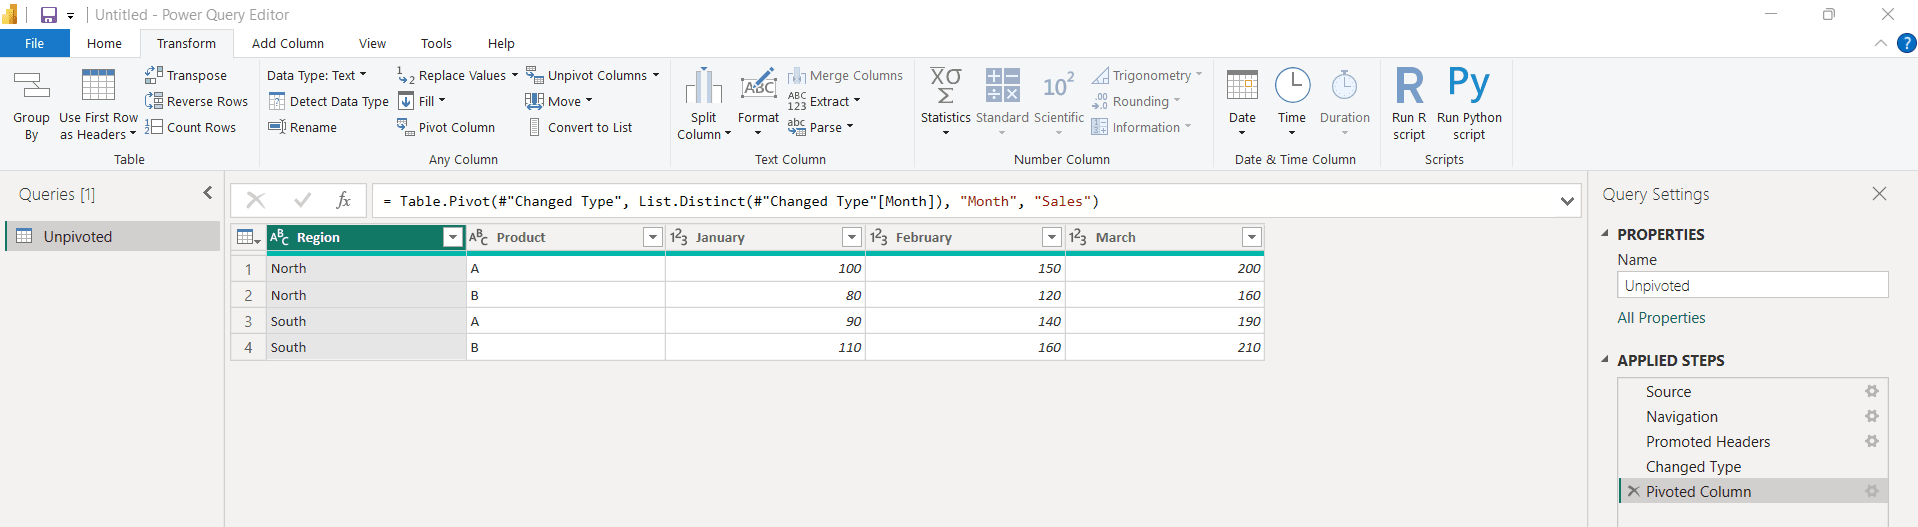
Pivoted Data
Unpivot in Power BI
What is unpivot in Power BI? Unpivoting in the Power Query Editor in Power BI is a transformation technique that converts data from a wide format to a long format. It essentially does the opposite of pivoting: instead of turning row values into column headers, it transforms column headers into row values. This process normalizes data tables, making them suitable for many analytical tasks that require a more standardized data structure. Unpivoting is useful when your data table contains multiple columns that are better represented as values in a single column. To unpivot data means to transform columns into rows. Let’s take the pivoted dataset:
| Region | Product | January | February | March |
|---|
| North | A | 100 | 150 | 200 |
| North | B | 80 | 120 | 160 |
| South | A | 90 | 140 | 190 |
| ... | ... | ... | ... | ... |
Steps to Unpivot Data:
- Load Pivoted Data: Begin with your data loaded into Power BI.
- Open Power Query Editor: Open the Power Query Editor by clicking "Transform Data".
- Select the Columns to Unpivot: Click to highlight the columns that you want to transform into rows. In your case, these would be 'January', 'February', 'March'.
- Unpivot Columns in Power BI:
- Right-click on one of the selected columns.
- Choose "Unpivot Columns" from the context menu.
- This will transform these columns into two new columns: one for the attribute (Month) and one for the value (Sales).
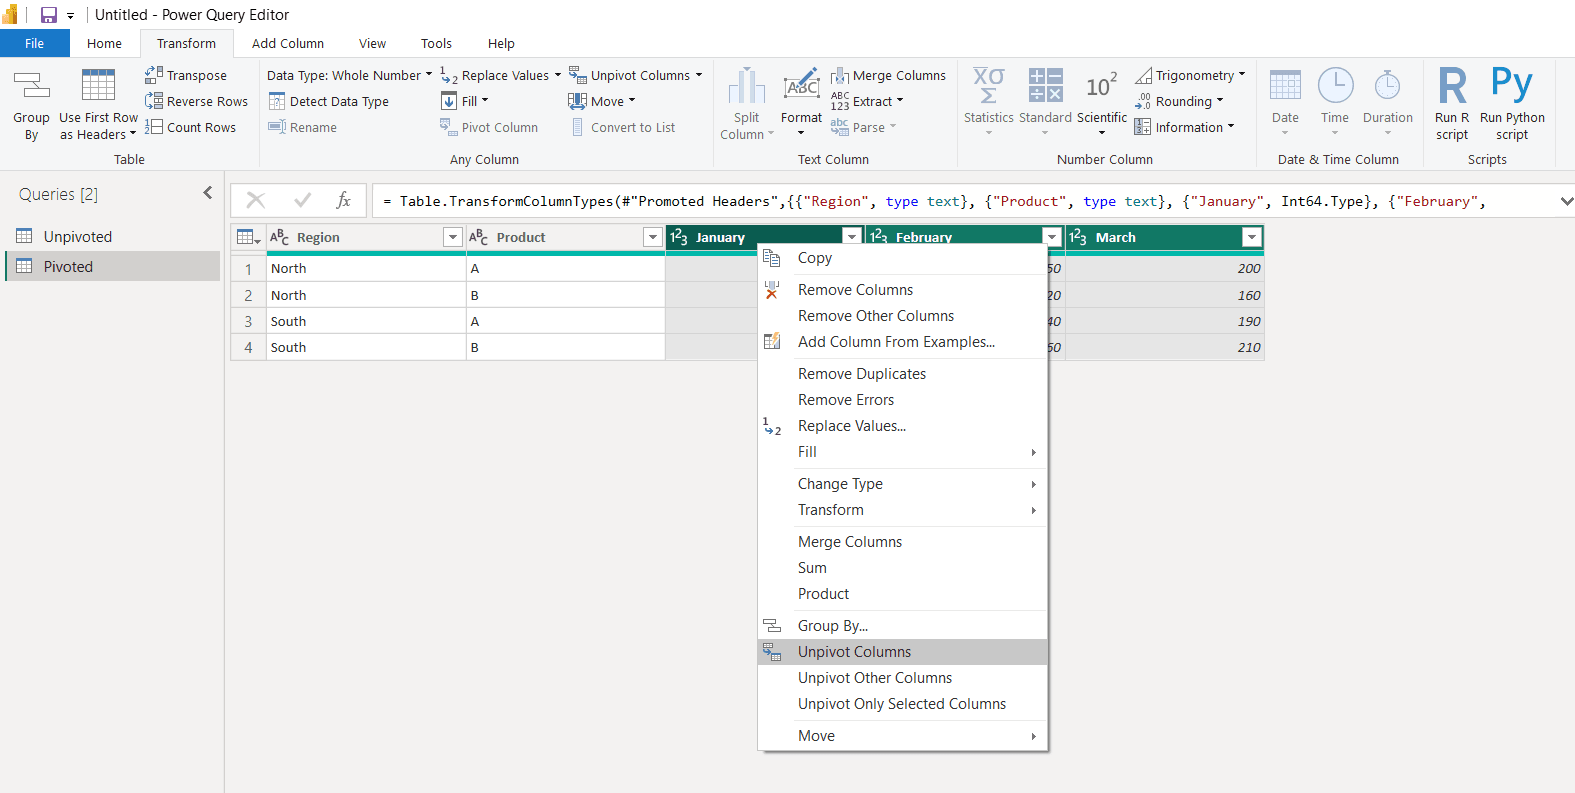
Unpivoting Data Using January, February and March Columns
5. Apply & Close: Confirm the changes and close the Power Query Editor.
Alternative Approaches
- Advanced Editor in Power Query: You can write M code directly in the Advanced Editor for more complex transformations that the UI might not handle directly.
- DAX: For dynamic pivots or calculations that need to update based on the context of the data model, you might consider using DAX formulas, although this is more complex and generally not used for structural data transformations like pivoting or unpivoting.
Benefits of Pivoting and Unpivoting
- Enhanced Data Manipulation: Pivoting and unpivoting allow for dynamic data reshaping, making it possible to adapt data structures for various analytical needs, thus enhancing flexibility and responsiveness to changing business requirements.
- Optimized Data Visualization: By pivoting data, analysts can create structured summaries ideal for visual representations, which help in revealing underlying trends. Unpivoting complements this by offering a detailed view when needed.
- Improved Data Quality Checks: Pivoting helps in aggregating data which can simplify the detection of outliers or inconsistencies. Conversely, unpivoting spreads out data, making it easier to spot duplicates or errors.
- Simplified Complex Data: Unpivoting breaks down complex datasets into a standardized format, which can then be re-aggregated via pivoting into more intuitive, summary forms for easier analysis and reporting.
- Flexible Data Aggregation: These techniques enable analysts to switch between detailed and summarized data views, facilitating custom aggregations and detailed analyses without the need for multiple datasets.
- Data Normalization: Unpivoting helps normalize data from a wide format, where each data point might have its own column, to a long format, which is more standardized and often necessary for integration with other datasets or for performing advanced analytics.
Difference Between Pivot and Unpivot in Power BI
The key difference between these two transformations lies in their approach to restructuring data:
- Pivoting is about creating a more summarized and compact representation by increasing the number of columns and reducing the number of rows.
- Unpivoting aims to expand the dataset into a more detailed format by increasing the number of rows and reducing the number of columns.
Use Cases of Pivoting and Unpivoting
Pivoting and unpivoting are versatile data transformation techniques that can be applied across various domains and scenarios. Here are some practical use cases for these methods in Power BI:
Financial Reporting:
- Pivoting: Consolidate financial data such as monthly revenues or expenses from different departments into a summarized form, making it easy to create comprehensive financial statements and perform year-over-year comparisons.
- Unpivoting: Convert financial tables with separate columns for each account type (like assets, liabilities, etc.) into a long format, which is essential for creating dynamic financial dashboards and detailed account tracking.
Sales Analysis:
- Pivoting: Summarize detailed sales data by product, region, and time period to analyze trends, identify best-selling products, and focus on high-performing regions.
- Unpivoting: Flatten sales reports that are initially in a wide format (with separate columns for each product) to facilitate deeper analysis, such as calculating the total sales volume across multiple products or conducting time series analysis.
Inventory Management:
- Pivoting: Aggregate data from inventory records to monitor stock levels by category or location, aiding in the visualization of inventory distribution and helping to optimize stock management.
- Unpivoting: Transform detailed inventory records into a format suitable for detailed trend analysis and historical tracking, especially useful in identifying patterns of inventory depletion.
Marketing Campaign Analysis:
- Pivoting: Evaluate the performance of various marketing channels by pivoting data to show metrics like engagement, conversion rates, and ROI by channel and campaign.
- Unpivoting: Break down comprehensive campaign data into a long format to perform detailed analysis on the effectiveness of different campaign elements across various demographics.
Conclusion
Pivot and unpivot transformations in Power BI are essential for effective data analysis and reporting. By mastering these techniques, you can significantly enhance your ability to manipulate and understand your data, leading to more insightful analyses and better-informed decision-making. Whether you are a beginner or an experienced Power BI user, these tools are indispensable in your data analysis toolkit.
Key Takeaways on Pivot and Unpivot in Power BI
- Pivot and unpivot are transformation techniques in Power BI that reshape data, facilitating analysis and reporting.
- Pivoting transforms data from a long to a wide format, turning unique column values into multiple columns, ideal for data summarization.
- To pivot, load data into Power BI, use the Power Query Editor to select and pivot columns, and choose aggregation methods if necessary.
- Unpivoting changes data from a wide to a long format, normalizing it by transforming column headers into row values.
- For unpivoting, use the Power Query Editor to select and apply the "Unpivot Columns" operation to the necessary columns.
- Advanced transformations can be performed using M code in the Advanced Editor and DAX for dynamic calculations.
- Benefits include enhanced data manipulation, improved visualization, quality checks, simplified complex data, and detailed analysis flexibility.
- Use cases cover financial reporting, sales analysis, inventory management, and marketing campaign analysis, utilizing pivots for summaries and unpivots for detailed views.


