Creating reports in Power BI allows businesses to visualize their data effectively, enabling informed decision-making. Power BI offers various features for designing, sharing, and managing reports, making it a powerful tool for data analysis. This article will guide you through designing basic reports in Power BI, including creating and sharing Power BI reports, and utilizing Power BI Report Server and paginated reports.
Introduction to Power BI Reports
Power BI reports are interactive data visualizations that help businesses understand their data. These reports can include a variety of visual elements such as charts, graphs, and tables. Power BI Report design involves selecting the right visuals, arranging them effectively, and ensuring the data is accurately represented.
Getting Started with Power BI Report Design
Designing a Power BI report starts with understanding the data and the insights you want to extract. Here’s a step-by-step guide to get you started:
1. Connect to Data Sources
Power BI supports various data sources, including Excel, SQL Server, and cloud-based sources like Azure. To begin designing a report:
- Open Power BI Desktop.
- Click on Get Data and select your data source.
- Load the data into Power BI.
2. Data Cleaning and Transformation
Before visualizing the data, ensure it’s clean and transformed appropriately. Use Power Query Editor in Power BI to remove duplicates, handle missing values, and transform the data as needed.
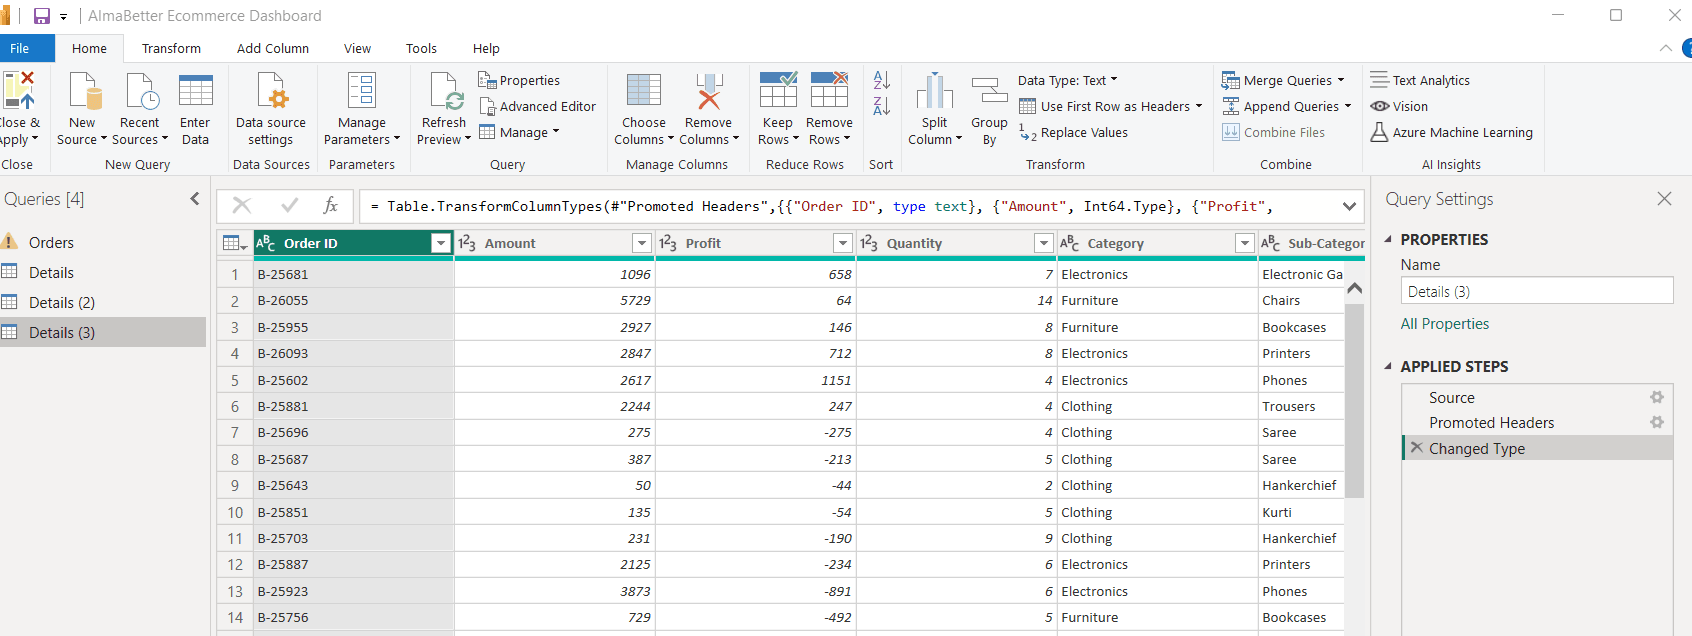
Transform Data
3. Designing the Report
Once your data is ready, you can start designing your report:
Choosing Visualizations
- Select Visualization Type: Power BI offers various visualization types like bar charts, line charts, pie charts, maps, and more. Choose the one that best represents your data.
- Drag and Drop Fields: Drag the necessary fields from the Fields pane onto the report canvas to create a visualization.
Customizing Visualizations
- Format Visuals: Use the Format pane to customize the appearance of your visualizations. You can change colors, add data labels, adjust axis properties, and more.
- Adding Filters and Slicers: Filters and slicers help in narrowing down the data displayed in your visualizations. Drag fields to the Filters pane to apply filters or add slicers directly to the report canvas.
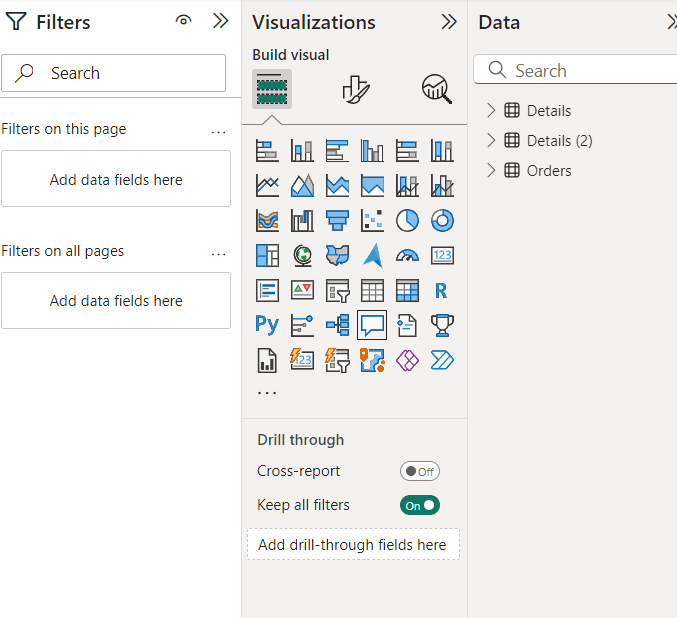
Visualizations pane
4. Enhancing Reports with Interactivity
Interactivity is a key feature of Power BI reports. It allows users to explore data dynamically:
- Drillthroughs: Enable drillthroughs to allow users to navigate from a summary view to a detailed view.
- Tooltips: Customize tooltips to show additional information when users hover over a data point.
- Bookmarks: Create bookmarks to capture specific views of your report. This helps in storytelling and guiding users through the data insights.
Power BI Reports Examples
Here’s a simple example of a Power BI report:
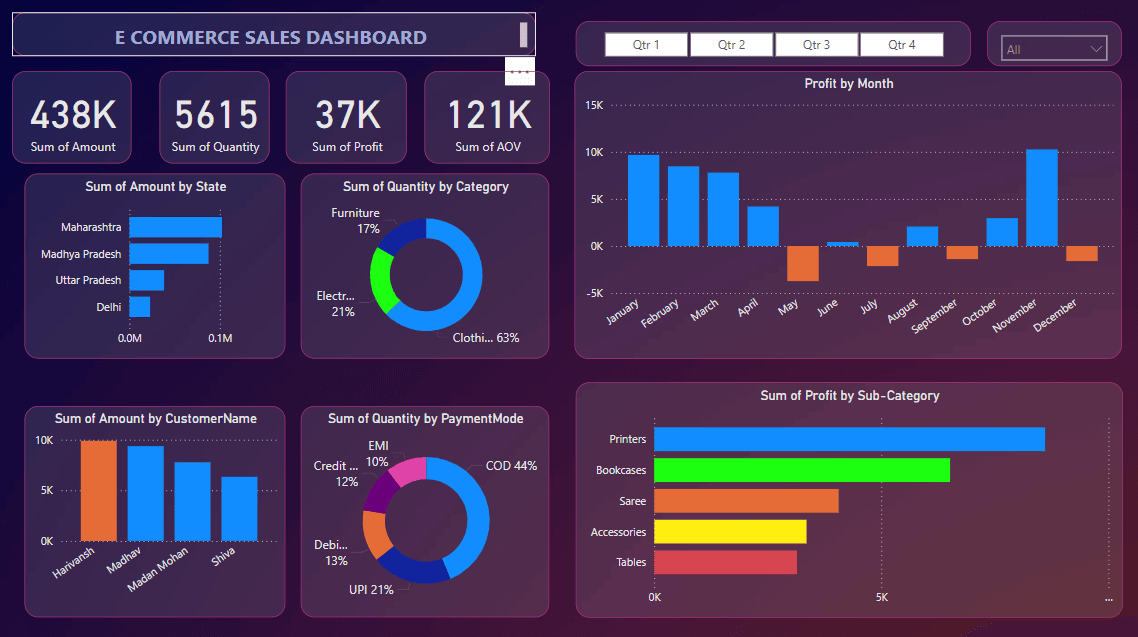
E Commerce Power BI Dashboard
E-Commerce Sales Report Breakdown
- Key Metrics: The cards display critical metrics: total sales amount (438K), total quantity sold (5615), total profit (37K), and average order value (121K). These provide a quick overview of the business performance.
- Sum of Amount by State: A bar chart showing Maharashtra as the top sales region, followed by Madhya Pradesh, Uttar Pradesh, and Delhi.
- Sum of Quantity by Category: A pie chart illustrating that Clothing leads with 63%, followed by Electronics (21%) and Furniture (17%).
- Profit by Month: A bar chart highlighting monthly profit trends, with peaks in January and December, and a loss in May.
- Sum of Amount by Customer Name: A bar chart showing top customers by sales amount, with Haimanti and Madhav leading.
- Sum of Quantity by Payment Mode: A pie chart indicating that Cash on Delivery (44%) is the most used payment method, followed by UPI (21%) and Debit (13%).
- Sum of Profit by Sub-Category: A bar chart revealing Printers and Bookcases as the most profitable sub-categories, followed by Sarees, Accessories, and Tables.
These visuals collectively provide a comprehensive view of the e-commerce business performance, aiding in data-driven decision-making.
Using Power BI Report Server
Power BI Report Server is an on-premises report server that allows you to store and manage Power BI reports. It’s ideal for organizations that need to keep their data on-premises due to compliance or security reasons.
Key Features of Power BI Report Server
- On-Premises Reporting: Store and manage reports on your own servers.
- Paginated Reports: Create detailed, print-ready reports.
- Secure Access: Control access to reports with robust security features.
Deploying Reports to Power BI Report Server
- Save your report as a .pbix file in Power BI Desktop.
- Open Power BI Report Server web portal.
- Upload the .pbix file to the portal.
Viewing Reports in Power BI Report Server
Users can access reports in the Power BI Report Server web portal. The report view in Power BI is interactive, allowing users to filter and drill down into the data.
Paginated Reports in Power BI
Power BI Paginated reports are designed for printing or PDF generation. These reports are ideal for detailed operational reports like invoices and purchase orders.
Creating Paginated Reports
- Use Power BI Report Builder to create paginated reports.
- Connect to your data source and design the report layout.
- Save the report as an .rdl file.
Benefits of Paginated Reports
- Detailed Reporting: Create highly detailed reports suitable for printing.
- Customization: Customize every aspect of the report layout.
- Export Options: Export reports to various formats, including PDF and Excel.
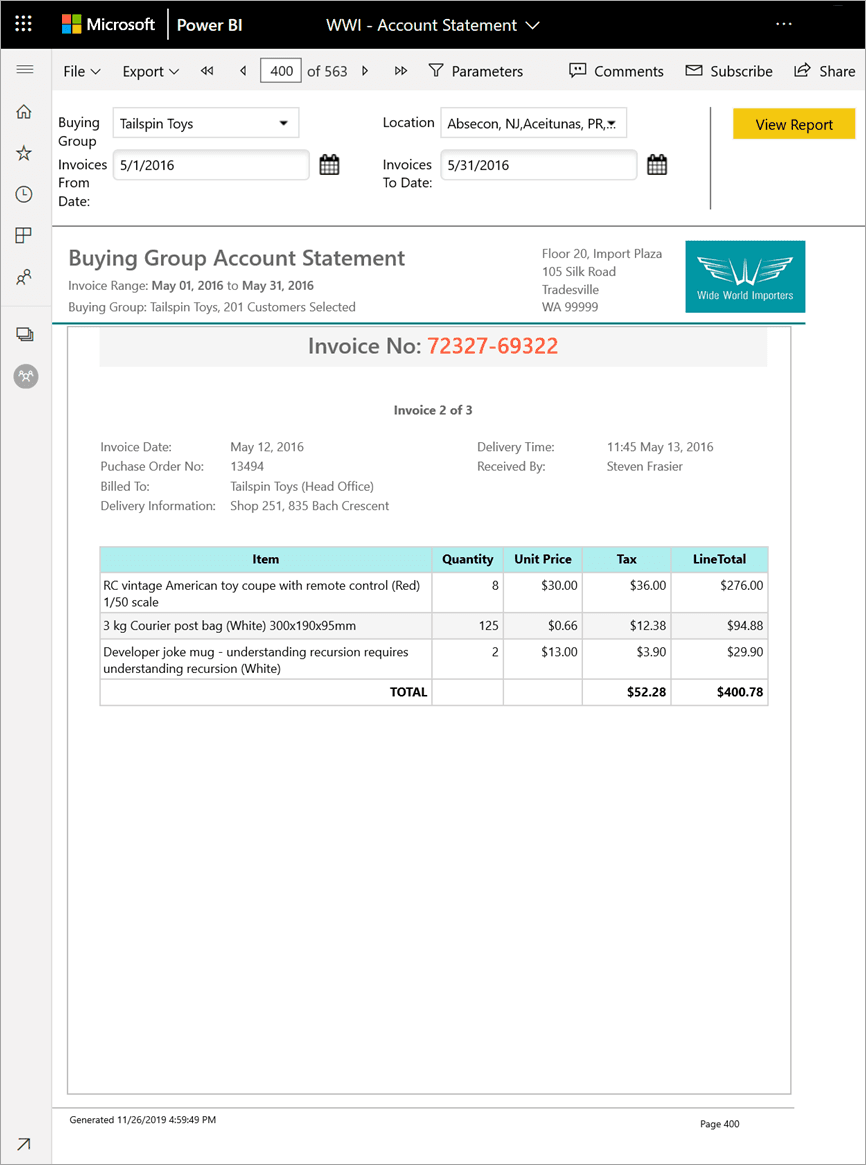
Paginated report Example
How to Share Power BI Reports
Sharing Power BI reports is crucial for collaboration and decision-making. Power BI offers several options for sharing reports:
1. Power BI Service
Upload your report to the Power BI Service and share it with others within your organization. Users can view the report in their web browser or mobile app.
2. Embedding Reports
Embed Power BI reports in SharePoint, websites, or applications to provide access to a broader audience.
3. Email Subscriptions
Set up email subscriptions to automatically send reports to stakeholders on a regular schedule.
4. Power BI Report Server
Share reports hosted on the Power BI Report Server by providing users access to the server portal.
Best Practices for Report Design
- Simplicity: Keep your design simple and uncluttered. Avoid overwhelming users with too many visualizations or excessive details.
- Consistency: Maintain a consistent design language throughout the report. Use uniform colors, fonts, and styles.
- Focus on Key Metrics: Highlight key metrics and insights that are crucial for decision-making.
- Accessibility: Ensure your reports are accessible to all users, including those with disabilities. Use alt text for images and ensure color contrast is sufficient.
Conclusion
Designing basic reports in Power BI involves understanding your data, choosing the right visuals, and effectively arranging them to tell a compelling story. With Power BI Report Server and paginated reports, you can manage and share detailed, on-premises reports securely. Whether you are a beginner or an advanced user, Power BI provides the tools and features necessary to create insightful and impactful reports.
Key Takeaways on Power BI Reports
- Power BI reports include charts, graphs, and tables to help businesses understand their data. Effective design involves selecting the right visuals and ensuring data accuracy.
- Power BI supports various data sources, including Excel, SQL Server, and Azure. Users load data into Power BI Desktop to start designing reports.
- Power Query Editor in Power BI is used to clean and transform data by removing duplicates and handling missing values before visualization.
- Select appropriate visualizations, customize their appearance, and use filters and slicers to narrow down displayed data. Customization includes adjusting colors, labels, and axis properties.
- Features like drillthroughs, customized tooltips, and bookmarks enable users to explore data dynamically and create storytelling experiences within reports.
- Power BI Report Server is an on-premises server for managing Power BI reports, suitable for organizations needing data compliance and security. It supports paginated reports for detailed, print-ready documents.
- Power BI offers various sharing options, including uploading to Power BI Service, embedding in SharePoint or websites, setting up email subscriptions, and using the Power BI Report Server for collaboration and access control.


