Power BI, a leading business intelligence tool from Microsoft, enables users to transform data into insightful visualizations. Among its robust features, Drill Through and Bookmarks stand out as powerful functionalities for enhancing data exploration and presentation. This article delves into what these features are, how they work, and the steps to effectively implement them in Power BI reports.
Understanding Drill Through in Power BI
What is Drill Through in Power BI?
Drill through in Power BI allows users to navigate from a summary-level data visualization to a detailed page focused on a specific data point. This feature is particularly useful when dealing with large datasets, where users need to focus on granular details without cluttering the main dashboard with excessive information.
Power BI Drill through adds an interactive dimension to reports, enabling end-users to explore data at various levels. For example, from a high-level sales overview, a user can drill through to a detailed page that shows sales performance by a specific region, product, or sales representative.
How to Add Drill Through in Power BI
Adding a Drill through feature to a Power BI report involves several steps. Here’s how to do it:
- Create a Detailed Page: Start by creating a new report page in Power BI that will serve as the Drill through destination. This page should focus on detailed data related to a specific dimension, such as a product sub-category type or a geographic region.
- Add Drill through Field: In the Visualizations pane, drag the field you want to filter by into the “Drill through” section. For instance, if you want users to drill through based on product data, drag the “Product” field into this section.
- Design the Detailed Report Page: Customize the detailed page with the necessary visualizations, ensuring it clearly presents the drilled-down data. Consider using charts, tables, and other visual elements to make the data easily interpretable.
- Add a Back Button: Power BI provides an option to include a "Back" button on the Drill through page, which allows users to return to the original report page. This can be added from the Insert tab by selecting “Buttons” and then choosing “Back.”
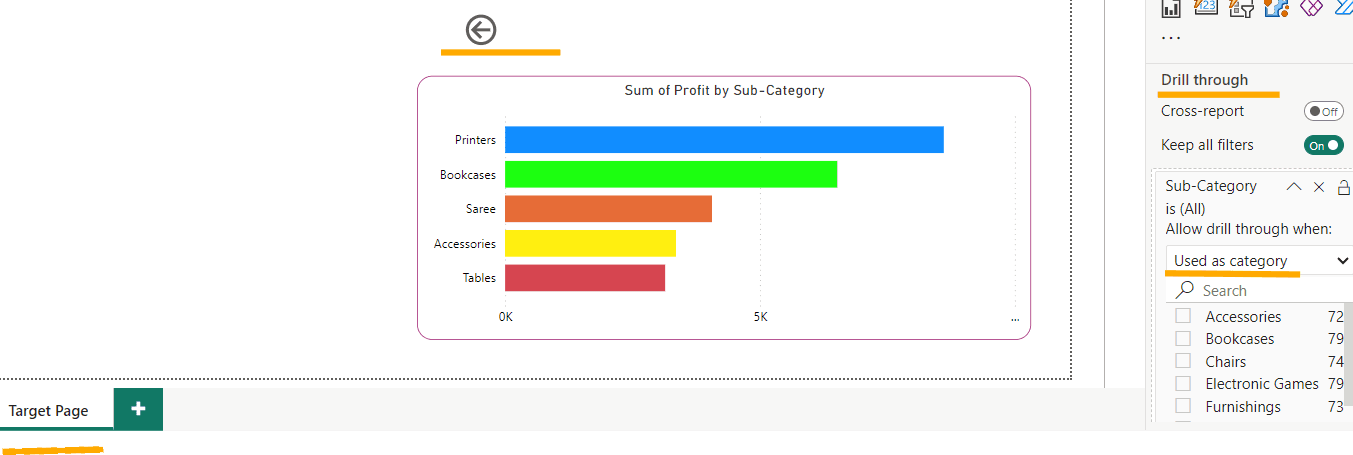
The Target page
- How to use Drill through in Power BI: Once set up, users can right-click on a data point in the main report and select the Drill through option to view detailed information on the specified Drill through page.
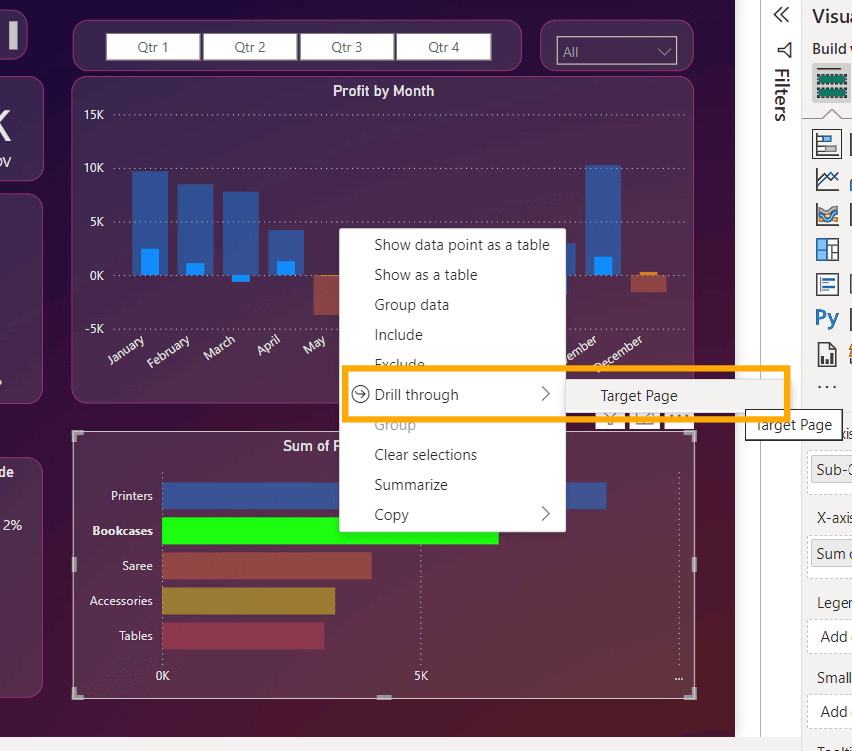
Drill Through Feature
Benefits of Drill Through in Power BI
- Data Exploration: Drill through enhances data exploration by allowing users to view detailed insights without cluttering the main dashboard.
- Contextual Analysis: It enables users to focus on specific aspects of the data, providing a contextual understanding of the metrics.
- User Engagement: By offering an interactive experience, it increases user engagement with the report, making data analysis more intuitive and meaningful.
Understanding Bookmarks in Power BI
What is Bookmark in Power BI?
A Bookmark in Power BI is a feature that captures the current state of a report page, including the visual selections, filters, and the Drill through state. Bookmarks allow users to save different views or snapshots of their reports and revisit them later. This functionality is particularly useful for storytelling in reports, as it enables users to guide viewers through a narrative by switching between different bookmarks.
How to Create Bookmark in Power BI
Creating a bookmark in Power BI is a straightforward process. Here’s how to do it:
- Set Up the Report Page: Start by configuring your report page to the desired state. This includes setting filters, slicers, and adjusting visuals as required.
- Open the Bookmarks Pane: Navigate to the “View” tab and select “Bookmarks” to open the Bookmarks pane. This pane is where you’ll manage all your bookmarks.
- Add a Bookmark: Click on “Add” in the Bookmarks pane to create a new bookmark. Power BI will capture the current state of the report page, including all visuals, filters, and the Drill through status.
- Rename and Organize Bookmarks: It’s helpful to rename bookmarks to something descriptive that reflects the captured state. You can also organize them in a sequence to tell a story or guide users through specific data points.
- Set Bookmark Actions: Bookmarks can be linked to buttons or images on the report page. By selecting a button, users can switch between different report states defined by the bookmarks. This is done by assigning a bookmark to an action button in the “Format” pane under “Action.”
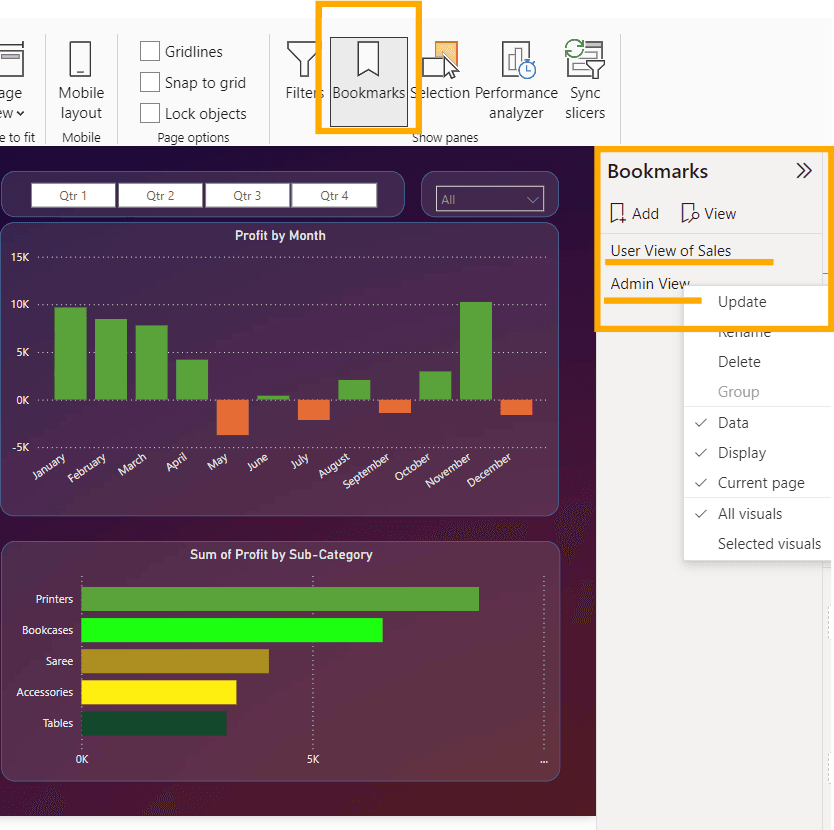
BookMarks Feature
How to Use Bookmarks in Power BI
Bookmarks can be used in various ways to enhance the interactivity and presentation of Power BI reports:
- Storytelling: Create a narrative by linking multiple bookmarks to guide users through a sequence of report views.
- Switch Views: Allow users to switch between different perspectives of the same data, such as monthly versus quarterly performance.
- Focus Mode: Use bookmarks to highlight specific data points or trends by adjusting the focus of visuals.
Benefits of Bookmarks in Power BI
- Enhanced User Experience: Bookmarks allow users to easily navigate through complex reports, improving their overall experience.
- Efficiency: By saving different report states, users can quickly switch between them, making data analysis more efficient.
- Custom Navigation: Users can create custom navigation paths in reports, enabling personalized data exploration.
Implementing Drill Through and Bookmarks Together
Combining Drillthrough and Bookmarks for Advanced Reporting
Power BI’s Drill through and bookmark features can be combined to create powerful and interactive reports. For instance, you can use Drill through to allow users to dive into detailed data and then use bookmarks to save and present different views of this detailed data.
Here’s a scenario where combining both features could be highly effective:
- Interactive Dashboards: A dashboard could provide a high-level overview of company performance. Users could drill through to view detailed sales data by region. Once in the detailed view, bookmarks could be used to switch between different metrics, such as revenue, customer count, or profit margin, providing a comprehensive analysis without leaving the detailed page.
- Guided Analysis: In a report designed for guided analysis, Drill through could lead users to detailed pages, and bookmarks could help them focus on specific insights by switching between pre-defined report states.
Best Practices for Using Drill through and Bookmarks
- Consistency: Ensure that the design and format of the Drill through pages and bookmarks are consistent with the overall report layout.
- User Instructions: Provide clear instructions or tooltips on how to use these features, ensuring that users are aware of the interactive capabilities of the report.
- Testing: Before sharing the report, test all Drill through paths and bookmark actions to ensure they work as intended and provide the expected insights.
Conclusion
Drill through Power BI and bookmarks are indispensable tools in Power BI that significantly enhance the interactivity and usability of reports. While Drill through allows for deeper exploration of data, bookmarks provide flexibility in saving and navigating through different report states. By mastering these features, users can create dynamic, user-friendly reports that cater to diverse analytical needs.
Key Takeaways on Drill through and Bookmarks in Power BI
- Drill through in Power BI allows users to navigate from summary data to detailed views, enhancing data exploration.
- Creating Drill through involves setting up a detailed page, adding a Drill through field, and customizing the report.
- Drill through pages can include a "Back" button to return users to the main report, ensuring a seamless experience.
- Benefits of Drill through include improved data exploration, contextual analysis, and increased user engagement.
- Bookmarks in Power BI capture the current state of a report page, including filters and visualizations, for later use.
- Creating Bookmarks involves setting up the report page, adding bookmarks, renaming them, and organizing them for easy access.
- Bookmarks are used for storytelling, switching views, and focusing on specific data points, enhancing the user experience.
- Combining Drill through and Bookmarks enables advanced reporting, such as interactive dashboards and guided analysis.
- Interactive Dashboards use Drill through for detailed views and bookmarks for switching between different data perspectives.
- Bookmarks improve efficiency by allowing quick access to different report states and custom navigation paths.


