Power BI, a powerful business analytics tool developed by Microsoft, enables users to visualize and analyze data more efficiently. Integrating Power BI within Excel combines the familiar spreadsheet capabilities of Excel with the advanced analytical features of Power BI, creating a dynamic environment for data analysis. This article explores the various aspects of integrating Power BI in Excel, including what Power BI in Excel entails, how to use it, and methods for exporting data between the two platforms.
What is Power BI in Excel?
Power BI in Excel refers to the ability to use Power BI's functionalities directly within Excel, enhancing the data analysis and visualization capabilities inherent to Excel. This integration is made possible through Power BI Publisher for Excel and the Power BI service, allowing users to connect their Excel data models and pivot tables to Power BI, and vice versa.
- Power BI Publisher for Excel: A tool that allows Excel users to pin Excel ranges, charts, and pivot tables directly to Power BI dashboards.
- Power BI Service: An online service where users can publish Excel workbooks, enabling interactive analysis with Power BI's robust visualization tools.
How to Use Power BI in Excel
Using Power BI within Excel involves several steps, from setting up the necessary tools to creating dynamic reports and dashboards. Here’s a step-by-step guide:
Installing Power BI Publisher for Excel:
- Download and install the Power BI Publisher for Excel from the official Microsoft website.
- Once installed, you will notice a new "Power BI" tab in Excel, providing access to various Power BI functionalities.

Power BI Publisher in Excel
Connecting Excel to Power BI:
- Open your Excel workbook.
- Navigate to the "Power BI" tab and select "Connect to Data."
- Sign in to your Power BI account and choose the desired dataset from Power BI to work within Excel.
Creating Power BI Reports in Excel:
- Utilize Excel’s capabilities such as PivotTables, PivotCharts, and standard Excel formulas to analyze the connected data.
- Use the "Pin" feature to pin Excel objects (charts, ranges, etc.) directly to your Power BI dashboard.

Power BI Publisher PIN in Excel
Using Power Query:
- Power Query is a powerful data connection technology in Excel that allows users to discover, connect, combine, and refine data across a wide variety of sources.
- Data loaded via Power Query can be transformed and cleaned before being utilized in Excel or Power BI for further analysis.
Publishing Excel Workbooks to Power BI:
- To publish an Excel workbook to Power BI, go to the "File" menu in Excel, select "Publish," and then choose "Upload to Power BI."
- Once uploaded, you can view and interact with your workbook using the Power BI service.
Exporting Data Between Power BI and Excel
Data exchange between Power BI and Excel is a critical aspect of integration, enabling users to take advantage of both platforms' unique capabilities. Here's how to export data from Power BI to Excel and vice versa:
How to Export Data from Power BI to Excel
1. Export Data from a Visual in Power BI Desktop:
- You can export the data directly from a visual (e.g., a table, matrix, or chart) in a Power BI report to Excel.
- Click on the visual from which you want to export data.
- Click on the ellipsis (...) in the top-right corner of the visual.
- Select Export data.
- Choose the format (.xlsx or .csv).
- Download the file.
- Note: This exports only the data underlying the selected visual, not the entire dataset.

Export data from a visual from Power BI desktop

Export the data from a visual in Power BI Desktop
2. Using Power BI Service:
- In Power BI Website, navigate to the report or dataset you want to export.
- Click on the "More options" (ellipsis) in the upper-right corner of a visual, and select "Export data."
- Choose the export format (e.g., .xlsx or .csv), and the data will be downloaded to your local system.

Export data from Power BI service
- You can export 2 types of data from Power BI Service - Summarized and Underlying.
- Data exported in a summarized form reflects the aggregated data as seen in the visualizations. This includes totals, averages, counts, and other aggregate metrics.
- Exporting underlying data retrieves the raw, unaggregated data that feeds into the visualizations. This data export includes all the rows and columns from the dataset that contribute to the visualization, providing a detailed view of the data sources.

Types of data to export

Exporting Underlying data
3. Using Analyze in Excel:
- Power BI allows users to analyze their Power BI data in Excel via the "Analyze in Excel" feature.
- In Power BI, select the dataset or report and click on "Analyze in Excel."
- This action generates an Excel file with a live connection to the Power BI dataset, allowing real-time data analysis in Excel.

Analyze in Excel in Power BI Service
- The dataset will be loaded into Excel as a Pivot Table connected to Power BI.
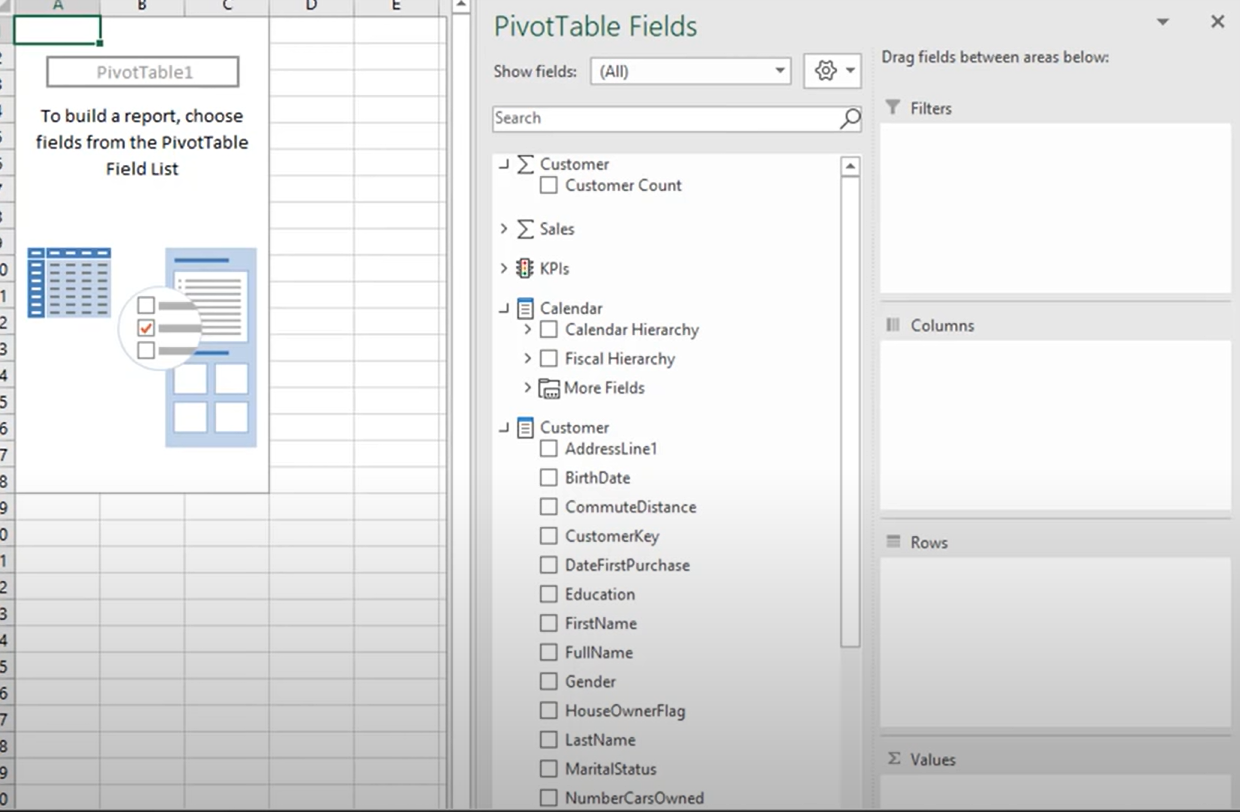
Pivot in Excel

Pivot in Excel

Analyze in Excel Results
4. Manual Export:
- For simple data exports, users can copy and paste data directly from Power BI tables or visualizations into Excel.
Exporting Data from Excel to Power BI
1. Importing Excel Files into Power BI:
- Navigate to Power BI and select "Get Data" > "Files" > "Local File."
- Choose your Excel workbook and import it into Power BI. You can opt to load the data as a dataset or view it directly within Power BI.

Get Data from Excel to Power BI
2. Using Power BI Publisher:
- With Power BI Publisher for Excel, you can pin Excel ranges, charts, and tables to your Power BI dashboard.
- Select the range in Excel you want to pin, click "Pin" under the Power BI tab, and select the destination dashboard in Power BI.
Benefits of Integrating Power BI in Excel
Integrating Power BI in Excel offers numerous advantages that enhance productivity and data-driven decision-making:
- Enhanced Data Visualization: Excel’s charts and tables can be supplemented with Power BI’s advanced visualization tools, making complex data easier to interpret.
- Real-Time Data Analysis: Power BI’s ability to update datasets in real-time is extended to Excel, ensuring that users are always working with the most current data.
- Seamless Data Sharing: The integration allows for seamless sharing of insights through Power BI dashboards, making collaboration more efficient.
- Unified Platform for Analysis: Users familiar with Excel’s environment can leverage Power BI’s capabilities without leaving the Excel interface, reducing the learning curve.
Best Practices for Using Power BI in Excel
To maximize the efficiency of using Power BI within Excel, consider the following best practices:
- Organize Your Data: Ensure that your data in Excel is clean and well-organized before importing it into Power BI. This reduces errors and improves the quality of insights.
- Leverage Power Query: Use Power Query to transform and clean your data before analysis. This ensures that the data used in Power BI is of the highest quality.
- Regular Updates: Keep both your Power BI and Excel applications updated to ensure compatibility and access to the latest features.
- Use Data Models: When working with large datasets, consider using data models in Excel to efficiently manage and analyze the data before integrating it with Power BI.
Conclusion
Integrating Power BI with Excel is a powerful way to enhance data analysis capabilities by combining the strengths of both platforms. Whether you're exporting data from Power BI to Excel for further analysis or using Excel to create reports that can be shared via Power BI, the integration offers a versatile and efficient solution for handling complex data. By following the steps and best practices outlined in this guide, users can fully leverage the potential of both Excel and Power BI to drive data-driven decision-making in their organizations.
Key Takeaways on Integrating Power BI in Excel
- Power BI in Excel integrates Excel’s spreadsheet capabilities with Power BI’s advanced analytics.
- Power BI Publisher for Excel allows pinning Excel elements to Power BI dashboards.
- Power BI service lets users publish Excel workbooks online for interactive analysis.
- Users can connect Excel to Power BI datasets for dynamic data analysis.
- Power Query in Excel enables data transformation before integration with Power BI.
- Data can be exported from Power BI to Excel via direct export, Analyze in Excel, or manual methods.
- Excel files can be imported into Power BI as datasets or reports.
- Benefits of integration include enhanced visualization, real-time data analysis, and seamless data sharing.
- Best practices include organizing data, leveraging Power Query, and using data models.


